关系型数据库管理系统查询处理一般分为4个阶段:
见下图
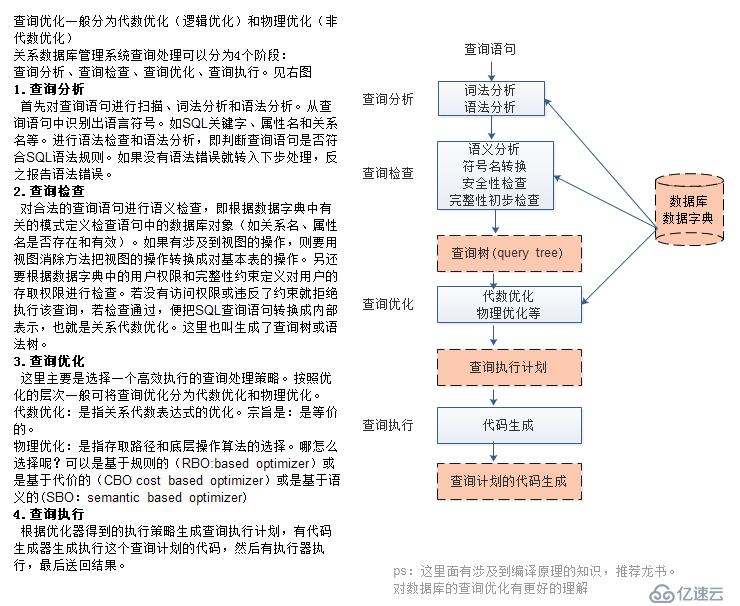
怎么验证这几个阶段对应在MySQL的关系呢?
这里实验的数据库版本:5.6.16-64.2-56
OS:CentOS release 6.5
Kernel:2.6.32-431.el6.x86_64
创建测试库及表、数据:
root@localhost[(none)]:14: >CREATE DATABASE querydb /!40100 DEFAULT CHARACTER SET utf8 /;
Query OK, 1 row affected (0.00 sec)
root@localhost[(none)]:15: >use querydb;
Database changed
root@localhost[querydb]:20: >create table t(id int auto_increment ,name varchar(50),primary key(id)) engine=innodb;
Query OK, 0 rows affected (0.02 sec)
root@localhost[querydb]:21: >insert into t values(NULL,'a');
Query OK, 1 row affected (0.00 sec)
root@localhost[querydb]:21: >insert into t values(NULL,'b');
Query OK, 1 row affected (0.00 sec)
root@localhost[querydb]:21: >insert into t values(NULL,'c');
Query OK, 1 row affected (0.01 sec)
打开MySQL的profile
root@localhost[querydb]:21: >set @@profiling=1;
Query OK, 0 rows affected, 1 warning (0.00 sec)
首先我们来查询一条正常的sql语句,看MySQL内部进行哪些操作。
root@localhost[querydb]:22: >select id,name from t;
+----+------+
| id | name |
+----+------+
| 1 | a |
| 2 | b |
| 3 | c |
+----+------+
3 rows in set (0.00 sec)
root@localhost[querydb]:24: >show profiles;
+----------+------------+-----------------------+
| Query_ID | Duration | Query |
+----------+------------+-----------------------+
| 1 | 0.00103500 | select id,name from t |
+----------+------------+-----------------------+
1 row in set, 1 warning (0.00 sec)
root@localhost[querydb]:24: >show profile for query 1;
+----------------------+----------+
| Status | Duration |
+----------------------+----------+
| starting | 0.000313 |
| checking permissions | 0.000029 |
| Opening tables | 0.000073 |
| init | 0.000058 |
| System lock | 0.000066 |
| optimizing | 0.000007 |
| statistics | 0.000044 |
| preparing | 0.000025 |
| executing | 0.000002 |
| Sending data | 0.000321 |
| end | 0.000007 |
| query end | 0.000018 |
| closing tables | 0.000018 |
| freeing items | 0.000017 |
| cleaning up | 0.000038 |
+----------------------+----------+
15 ows in set, 1 warning (0.00 sec)
从上面大体上可以看出,
首先检查权限,权限检查完后open table操作,然后进行对元数据进行lock操作、然后优化、预编译、最后执行,到Sending data时,这时已经推送到存储引擎层了进行拉取数据。最后释放lock、关闭表并进行清理操作。
先说说各个阶段的特征:
starting:语法分析与词法分析阶段
checking permissions:用户权限检查
Opening tables:表权限检查
init:表的列权限检查
System lock:获得表的一些lock信息
optimizing:逻辑优化(代数优化),主要RBO优化
statistics:物理优化(非代数优化),主要是CBO优化
preparing和executing:生成代码并执行
Sending data:也有可能包括执行、提取和发送数据的过程中。
一、查询分析
1.模拟sql关键字错误
root@localhost[querydb]:31: >selectt id,name from t;
ERROR 1064 (42000): You have an error in your SQL syntax; check the manual that corresponds to your MySQL server version for the right syntax to use near 'selectt id,name from t' at line 1
root@localhost[querydb]:31: >show profiles;
+----------+------------+------------------------+
| Query_ID | Duration | Query |
+----------+------------+------------------------+
| 1 | 0.00103500 | select id,name from t |
| 2 | 0.00022225 | selectt id,name from t |
+----------+------------+------------------------+
2 rows in set, 1 warning (0.00 sec)
root@localhost[querydb]:32: >show profile for query 2;
+---------------+----------+
| Status | Duration |
+---------------+----------+
| starting | 0.000154 |
| freeing items | 0.000026 |
| cleaning up | 0.000043 |
+---------------+----------+
3 rows in set, 1 warning (0.00 sec)
再来一个
root@localhost[querydb]:45: >select id,name fr0m t;
ERROR 1064 (42000): You have an error in your SQL syntax; check the manual that corresponds to your MySQL server version for the right syntax to use near 't' at line 1
root@localhost[querydb]:45: >show profiles;
+----------+------------+------------------------+
| Query_ID | Duration | Query |
+----------+------------+------------------------+
| 1 | 0.00034325 | select id,name from t |
| 2 | 0.00006925 | selectt id,name from t |
| 3 | 0.00018800 | select id,name fr0m t |
+----------+------------+------------------------+
3 rows in set, 1 warning (0.00 sec)
root@localhost[querydb]:45: >show profile for query 3;
+---------------+----------+
| Status | Duration |
+---------------+----------+
| starting | 0.000134 |
| freeing items | 0.000018 |
| cleaning up | 0.000036 |
+---------------+----------+
3 rows in set, 1 warning (0.00 sec)
通过对比发现,starting应该是进行语法分析和词法分析。
为什么要进行语法分析和词法分析?
其实跟我们平时的母语的造句一样,比如:
去 我 饭 吃 这个四个字
按照我们人正常的逻辑造句应该是:我去吃饭
但计算机就不一样了,可能会出现好多:
去我饭吃
去我吃饭
我去吃饭
我去饭吃
.......
......
计算机会根据一定的规则,就像我们的主谓宾格式造句一样,从中组合,但有一种可能,就是组合了即没有语法错误也没有词法错误但意思不一样的情况。这里假设:我要吃饭和要我吃饭,语法和词法都没有错误,但语义不同,这时计算机就要进行语义分析了。
这里面的判断规则有自动机进行判断,也叫图灵机(是伟大的计算机科学之父:图灵 发明的,图灵奖想必大家都熟悉吧^_^),不过龙书(编译原理)里会有详细介绍
二、查询检查
root@localhost[querydb]:45: >select ida,name from t; #表存在,字段不存在
ERROR 1054 (42S22): Unknown column 'ida' in 'field list'
root@localhost[querydb]:19: >show profiles;
+----------+------------+------------------------+
| Query_ID | Duration | Query |
+----------+------------+------------------------+
| 1 | 0.00034325 | select id,name from t |
| 2 | 0.00006925 | selectt id,name from t |
| 3 | 0.00018800 | select id,name fr0m t |
| 4 | 0.00096275 | select ida,name from t |
+----------+------------+------------------------+
4 rows in set, 1 warning (0.00 sec)
root@localhost[querydb]:19: >show profile for query 4;
+----------------------+----------+
| Status | Duration |
+----------------------+----------+
| starting | 0.000531 |
| checking permissions | 0.000037 |
| Opening tables | 0.000133 |
| init | 0.000116 |
| end | 0.000017 |
| query end | 0.000018 |
| closing tables | 0.000027 |
| freeing items | 0.000032 |
| cleaning up | 0.000052 |
+----------------------+----------+
9 rows in set, 1 warning (0.00 sec)
root@localhost[querydb]:19: >select id,name from tab; #id,name是表t的字段,而tab表不存在
ERROR 1146 (42S02): Table 'querydb.tab' doesn't exist
root@localhost[querydb]:23: >show profiles;
+----------+------------+-------------------------+
| Query_ID | Duration | Query |
+----------+------------+-------------------------+
| 1 | 0.00034325 | select id,name from t |
| 2 | 0.00006925 | selectt id,name from t |
| 3 | 0.00018800 | select id,name fr0m t |
| 4 | 0.00096275 | select ida,name from t |
| 5 | 0.00117675 | select id,name from tab |
+----------+------------+-------------------------+
5 rows in set, 1 warning (0.00 sec)
root@localhost[querydb]:23: >show profile for query 5;
+----------------------+----------+
| Status | Duration |
+----------------------+----------+
| starting | 0.000621 |
| checking permissions | 0.000039 |
| Opening tables | 0.000367 | 感觉是不是哪里
| query end | 0.000023 | 不对劲,是不是
| closing tables | 0.000006 | 少了init阶段
| freeing items | 0.000055 |
| cleaning up | 0.000066 |
+----------------------+----------+
7 rows in set, 1 warning (0.00 sec)
所以从上面可以观察到,这里checking permissions你可以进行测试。这里我不在进行测试。【赋予用户test什么权限都没有:grant usage on . to test@'%' identified by 'test';和赋予test2用户只有查询t表中id列的权限:grant select(id) on querydb.t to test2@'%' identified by 'test2';】,这里测试略
checking permissions: 对MySQL的连接用户进行权限检查。
Opening tables: 对表权限进行检查。
init阶段:对表中的列进行权限检查。
三、检查优化
实验的sql语句:
select 1;
select id,name from t ;
select id,name from t where 0=1;
三个语句查看其变化。
root@localhost[querydb]:36: >select 1;
+---+
| 1 |
+---+
| 1 |
+---+
1 row in set (0.00 sec)
root@localhost[querydb]:36: >show profiles;
+----------+------------+----------------------------+
| Query_ID | Duration | Query |
+----------+------------+----------------------------+
| 1 | 0.00034325 | select id,name from t |
| 2 | 0.00006925 | selectt id,name from t |
| 3 | 0.00018800 | select id,name fr0m t |
| 4 | 0.00096275 | select ida,name from t |
| 5 | 0.00117675 | select id,name from tab |
| 6 | 0.00115800 | select id,name,abc from t |
| 7 | 0.00029450 | select 1 |
+----------+------------+----------------------------+
7 rows in set, 1 warning (0.00 sec)
root@localhost[querydb]:36: >show profile for query 7;
+----------------------+----------+
| Status | Duration |
+----------------------+----------+
| starting | 0.000196 |
| checking permissions | 0.000006 |
| Opening tables | 0.000007 |
| init | 0.000016 |
| optimizing | 0.000010 |
| executing | 0.000013 |
| end | 0.000008 |
| query end | 0.000006 |
| closing tables | 0.000001 |
| freeing items | 0.000014 |
| cleaning up | 0.000019 |
+----------------------+----------+
11 rows in set, 1 warning (0.00 sec)
root@localhost[querydb]:36: >select id,name from t ;
+----+------+
| id | name |
+----+------+
| 1 | a |
| 2 | b |
| 3 | c |
+----+------+
3 rows in set (0.00 sec)
root@localhost[querydb]:38: >show profiles;
+----------+------------+----------------------------+
| Query_ID | Duration | Query |
+----------+------------+----------------------------+
| 1 | 0.00034325 | select id,name from t |
| 2 | 0.00006925 | selectt id,name from t |
| 3 | 0.00018800 | select id,name fr0m t |
| 4 | 0.00096275 | select ida,name from t |
| 5 | 0.00117675 | select id,name from tab |
| 6 | 0.00115800 | select id,name,abc from t |
| 7 | 0.00029450 | select 1 |
| 8 | 0.00074025 | select id,name from t |
+----------+------------+----------------------------+
8 rows in set, 1 warning (0.00 sec)
root@localhost[querydb]:38: >show profile for query 8;
+----------------------+----------+
| Status | Duration |
+----------------------+----------+
| starting | 0.000274 |
| checking permissions | 0.000024 |
| Opening tables | 0.000059 |
| init | 0.000036 |
| System lock | 0.000029 |
| optimizing | 0.000008 |
| statistics | 0.000031 |
| preparing | 0.000021 |
| executing | 0.000002 |
| Sending data | 0.000172 |
| end | 0.000011 |
| query end | 0.000012 |
| closing tables | 0.000013 |
| freeing items | 0.000018 |
| cleaning up | 0.000031 |
+----------------------+----------+
15 rows in set, 1 warning (0.00 sec)
root@localhost[querydb]:38: >select id,name from t where 0=1;
Empty set (0.00 sec)
root@localhost[querydb]:41: >show profiles;
+----------+------------+---------------------------------+
| Query_ID | Duration | Query |
+----------+------------+---------------------------------+
| 1 | 0.00034325 | select id,name from t |
| 2 | 0.00006925 | selectt id,name from t |
| 3 | 0.00018800 | select id,name fr0m t |
| 4 | 0.00096275 | select ida,name from t |
| 5 | 0.00117675 | select id,name from tab |
| 6 | 0.00115800 | select id,name,abc from t |
| 7 | 0.00029450 | select 1 |
| 8 | 0.00074025 | select id,name from t |
| 9 | 0.00058500 | select id,name from t where 0=1 |
+----------+------------+---------------------------------+
9 rows in set, 1 warning (0.00 sec)
root@localhost[querydb]:41: >show profile for query 9;
+----------------------+----------+
| Status | Duration |
+----------------------+----------+
| starting | 0.000279 |
| checking permissions | 0.000015 |
| Opening tables | 0.000046 |
| init | 0.000057 |
| System lock | 0.000019 |
| optimizing | 0.000025 |
| executing | 0.000014 |
| end | 0.000005 |
| query end | 0.000008 |
| closing tables | 0.000010 |
| freeing items | 0.000020 |
| cleaning up | 0.000089 |
+----------------------+----------+
12 rows in set, 1 warning (0.00 sec)
为了便于观察,我这里查看其语句的执行计划然后看执行的语句。
下面输出的有点不好看,可以看下面的截图。
root@localhost[querydb]:10: >explain extended select id,name from t where 0=1;
+----+-------------+-------+------+---------------+------+---------+------+------+----------+------------------+
| id | select_type | table | type | possible_keys | key | key_len | ref | rows | filtered | Extra |
+----+-------------+-------+------+---------------+------+---------+------+------+----------+------------------+
| 1 | SIMPLE | NULL | NULL | NULL | NULL | NULL | NULL | NULL | NULL | Impossible WHERE |
+----+-------------+-------+------+---------------+------+---------+------+------+----------+------------------+
1 row in set, 1 warning (0.00 sec)
root@localhost[querydb]:11: >show warnings;
+-------+------+------------------------------------------------------------------------------------------------------------+
| Level | Code | Message |
+-------+------+------------------------------------------------------------------------------------------------------------+
| Note | 1003 | / select#1 / select querydb.t.id AS id,querydb.t.name AS name from querydb.t where 0 |
+-------+------+------------------------------------------------------------------------------------------------------------+
1 row in set (0.00 sec)
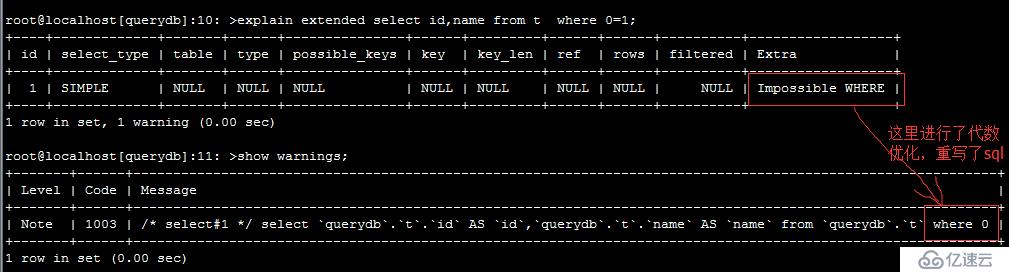
通过三个sql语句的执行情况发现。
optimizing阶段:为代数优化阶段
statistics和preparing阶段:为物理优化阶段,从字面信息上来看,可以理解是收集统计信息,生成执行计划,选择最优的存取路径进行执行。
同时有没有发现Sending data,说明这时已经到存储引擎层了去拉取数据,对比上面select 1和where 0=1 都没有Sending data,更可以很好理解,但这里有个问题?MySQL层和存储引擎层是通过接口实现的,当查询的结果返回时怎么知道返回哪个线程呢?其实在内部,每个查询都会分配一个查询线程ID的,根据线程ID编号来的。
一、 查询执行
root@localhost[querydb]:41: >select id,name from t;
+----+------+
| id | name |
+----+------+
| 1 | a |
| 2 | b |
| 3 | c |
+----+------+
3 rows in set (0.00 sec)
root@localhost[querydb]:15: >show profiles;
+----------+------------+---------------------------------+
| Query_ID | Duration | Query |
+----------+------------+---------------------------------+
| 1 | 0.00034325 | select id,name from t |
| 2 | 0.00006925 | selectt id,name from t |
| 3 | 0.00018800 | select id,name fr0m t |
| 4 | 0.00096275 | select ida,name from t |
| 5 | 0.00117675 | select id,name from tab |
| 6 | 0.00115800 | select id,name,abc from t |
| 7 | 0.00029450 | select 1 |
| 8 | 0.00074025 | select id,name from t |
| 9 | 0.00058500 | select id,name from t where 0=1 |
| 10 | 0.00194675 | select id,name from t |
+----------+------------+---------------------------------+
10 rows in set, 1 warning (0.00 sec)
root@localhost[querydb]:15: >show profile for query 10;
+----------------------+----------+
| Status | Duration |
+----------------------+----------+
| starting | 0.000763 |
| checking permissions | 0.000050 |
| Opening tables | 0.000184 |
| init | 0.000178 |
| System lock | 0.000076 |
| optimizing | 0.000025 |
| statistics | 0.000095 |
| preparing | 0.000055 |
| executing | 0.000002 |
| Sending data | 0.000335 |
| end | 0.000018 |
| query end | 0.000028 |
| closing tables | 0.000023 |
| freeing items | 0.000041 |
| cleaning up | 0.000076 |
+----------------------+----------+
15 rows in set, 1 warning (0.00 sec)
executing:为执行阶段了。
这里还有一个System lock阶段:其实当执行DDL、DML操作时,MySQL会在内部对表的元数据进行加锁还有其他的锁,比如S锁,X锁,IX锁,IS锁等,用于解决或者保证DDL操作与DML操作之间的一致性。【可以参看<<InnoDB存储引擎技术内幕>>或事务处理与实现】
参考书籍:
【编译原理】 [美] Alfred V.Aho,[美] Monica S.Lam,[美] Ravi Sethi 等 著;赵建华,郑滔 等 译
【数据库系统概论 】 王珊,萨师煊 著
【数据库查询优化器的艺术:原理解析与SQL性能优化】 李海翔 著
【InnoDB存储引擎技术内幕】 姜承尧 著
【事务处理与实现】
免责声明:本站发布的内容(图片、视频和文字)以原创、转载和分享为主,文章观点不代表本网站立场,如果涉及侵权请联系站长邮箱:is@yisu.com进行举报,并提供相关证据,一经查实,将立刻删除涉嫌侵权内容。


