配置zendstudio的xdebug调试过程:
1>先修改下php的配置文件php.ini,开户xdebug扩展,在该文件最后加入如下内容:
[Zend]
zend_extension_ts=d:/wamp/bin/php/php5.3.13/zend_ext/php_xdebug-2.2.0-5.3-vc9.dll
xdebug.remote_enable=on
xdebug.remote_host=localhost
xdebug.remote_handler=dbgp
xdebug.remote_port=9999
2> 重启apache, 打开一个php页面,用phpinfo()函数查看,xdebug功能是否已经打开,若看到如下界面,则表示功能开启成功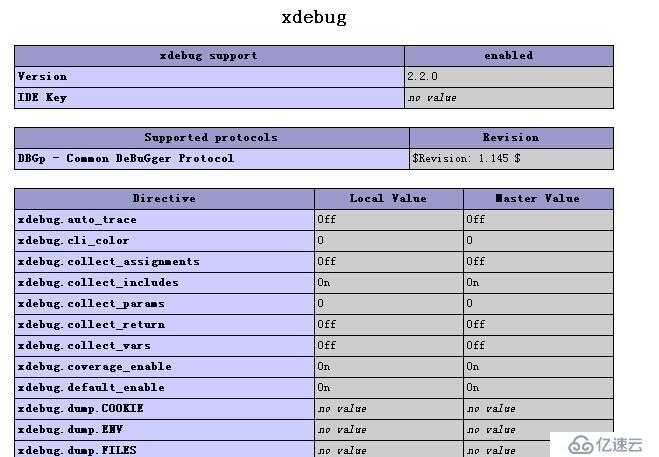
3> 配置zendstudio开发工具
1.选择xdebug模式,window->preferences->php->debug->选择XDebug如下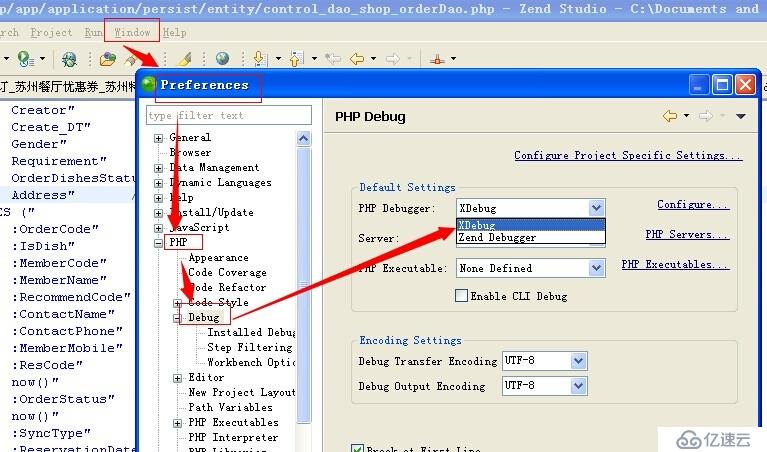
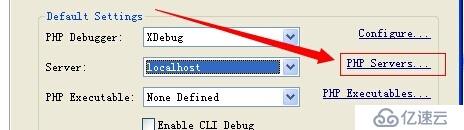
4>点击Configure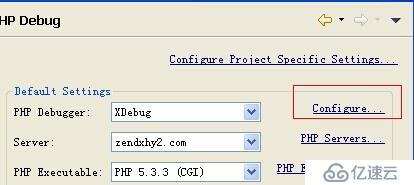
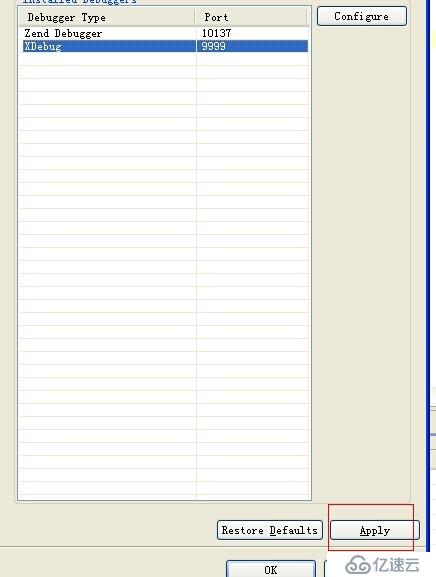
5>在弹出窗口中配置XDebug端口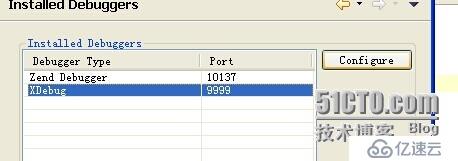
6>点击上面的"Configure",将port配置为php.ini中设置的端口(我上面设置的是xdebug.remote_port=9999,所以这里也应该是9999)
7>配置完后点击该弹出窗右下角的"Apply"应用配置,如下图
8>配置Debug服务器,点击PHP_Servers如下图
9>配置名称,url,路径,如下图: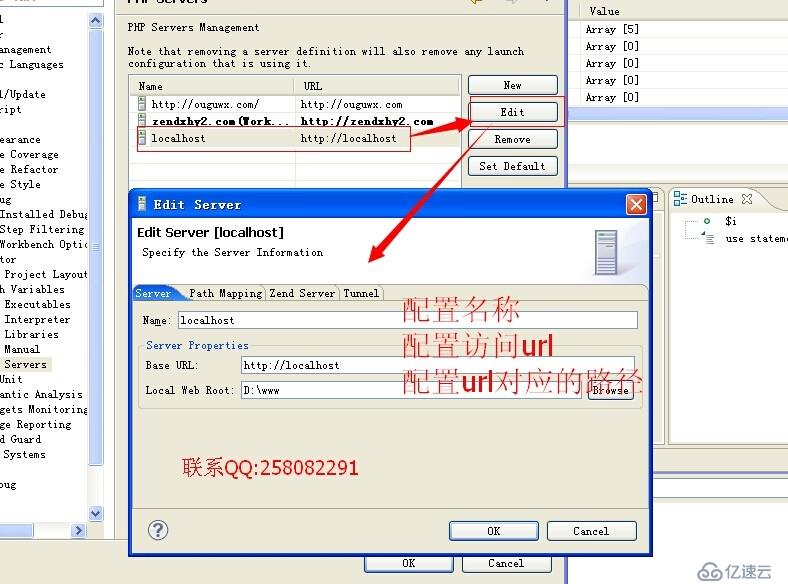
9>到这里所有配置完成了,呵呵。接下来选择你要调试的文件,右击它,如下图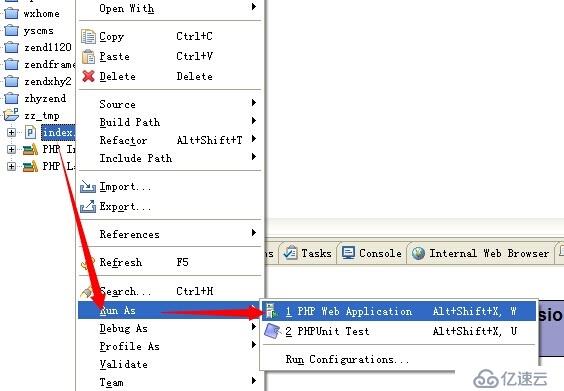
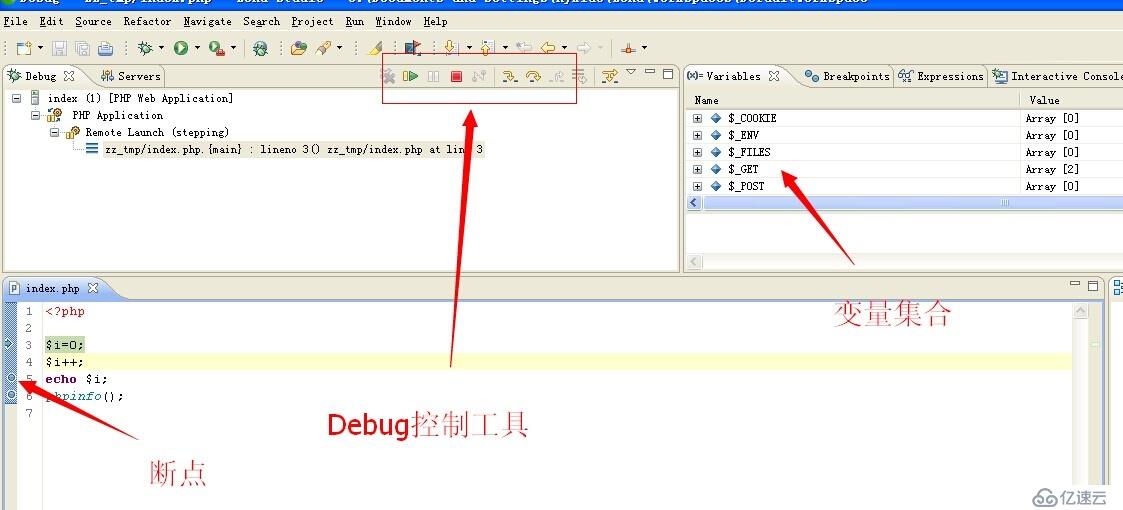
10>久违的debug窗口出现了,如下图:
免责声明:本站发布的内容(图片、视频和文字)以原创、转载和分享为主,文章观点不代表本网站立场,如果涉及侵权请联系站长邮箱:is@yisu.com进行举报,并提供相关证据,一经查实,将立刻删除涉嫌侵权内容。


