RиҜӯиЁҖеҸҜи§ҶеҢ–UpSetRеҢ…жҖҺд№ҲдҪҝз”Ё
жң¬зҜҮеҶ…е®№д»Ӣз»ҚдәҶвҖңRиҜӯиЁҖеҸҜи§ҶеҢ–UpSetRеҢ…жҖҺд№ҲдҪҝз”ЁвҖқзҡ„жңүе…ізҹҘиҜҶпјҢеңЁе®һйҷ…жЎҲдҫӢзҡ„ж“ҚдҪңиҝҮзЁӢдёӯпјҢдёҚе°‘дәәйғҪдјҡйҒҮеҲ°иҝҷж ·зҡ„еӣ°еўғпјҢжҺҘдёӢжқҘе°ұи®©е°Ҹзј–еёҰйўҶеӨ§е®¶еӯҰд№ дёҖдёӢеҰӮдҪ•еӨ„зҗҶиҝҷдәӣжғ…еҶөеҗ§пјҒеёҢжңӣеӨ§е®¶д»”з»Ҷйҳ…иҜ»пјҢиғҪеӨҹеӯҰжңүжүҖжҲҗпјҒ
д»ҠеӨ©д»Ӣз»ҚдёҖдёӘRеҢ…UpSetRпјҢдё“й—Ёз”ЁжқҘйӣҶеҗҲеҸҜи§ҶеҢ–пјҢжқҘжәҗдәҺUpSetпјҢPythonйҮҢйқўд№ҹжңүдёҖдёӘзӣёдјјзҡ„еҢ…py-upsetгҖӮжӯӨеӨ–иҝҳжңүдёӘUpSetR shiny appд»ҘеҸҠжәҗд»Јз ҒгҖӮ
е®үиЈ…
дёӨз§Қж–№ејҸе®үиЈ…пјҡ
#д»ҺCRANе®үиЈ… install.packages("UpSetR") #д»ҺGithubдёҠе®үиЈ… devtools::install_github("hms-dbmi/UpSetR")ж•°жҚ®еҜје…Ҙ
UpSetRжҸҗдҫӣдәҶдёӨдёӘеҮҪж•°fromListд»ҘеҸҠfromExpressionе°Ҷж•°жҚ®иҪ¬жҚўдёәUpsetRйҖӮз”Ёзҡ„ж•°жҚ®ж јејҸгҖӮ
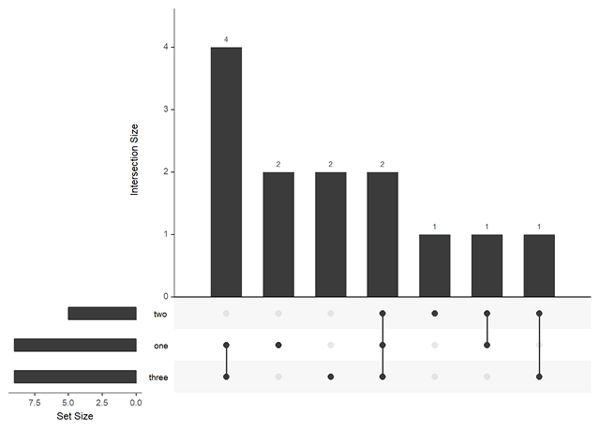
#fromList listinput <- list(one = c(1, 2, 3, 5, 7, 8, 11, 12, 13), two = c(1, 2, 4, 5, 10), three = c(1, 5, 6, 7, 8, 9, 10, 12, 13)) #fromExpression expressionInput <- c(one = 2, two = 1, three = 2, `one&two` = 1, `one&three` = 4, `two&three` = 1, `one&two&three` = 2)
жҺҘдёӢжқҘе°ұеҸҜд»Ҙз»ҳеҲ¶з»ҳеҲ¶еӣҫеҪўдәҶ
library(UpSetR) upset(fromList(listinput), order.by = "freq") #дёӢйқўз»ҳеҲ¶зҡ„еӣҫеҪўзӯүеҗҢдәҺдёҠеӣҫ upset(fromExpression(expressionInput), order.by = "freq")
еҸӮж•°иҜҰи§Ј
дёӢйқўжүҖжңүзҡ„дҫӢеӯҗйғҪе°ҶдҪҝз”ЁUpSetRеҶ…зҪ®зҡ„ж•°жҚ®йӣҶmoviesжқҘз»ҳеҲ¶гҖӮ
#еҜје…Ҙж•°жҚ® movies <- read.csv(system.file("extdata", "movies.csv", package = "UpSetR"), header = TRUE, sep = ";") #е…ҲеӨ§иҮҙжөҸи§ҲдёҖдёӢиҜҘж•°жҚ®йӣҶ,ж•°жҚ®йӣҶеӨӘй•ҝпјҢе°ұеҸӘзңӢеүҚеҮ еҲ— knitr::kable(head(movies[,1:10])) 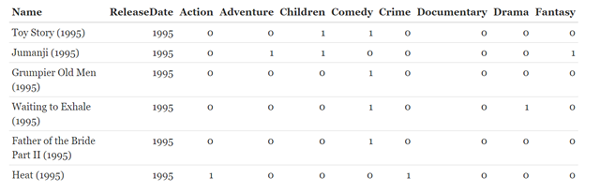
иҜҘж•°жҚ®йӣҶеұ•зӨәзҡ„жҳҜз”өеҪұеҗҚ(name)гҖҒеҸ‘иЎҢж—¶й—ҙ(ReleaseDate)д»ҘеҸҠз”өеҪұзұ»еһӢпјҢеӨҡдәҶеҺ»дәҶе°ұдёҚиҜҰи®ІдәҶпјҢиҮӘдёӘеҸҜд»ҘзңӢеҺ»гҖӮ
UpsetRз»ҳеҲ¶йӣҶеҗҲеҸҜи§ҶеҢ–еӣҫеҪўдҪҝз”ЁеҮҪж•°upset()гҖӮ
upset(movies, nsets = 6, number.angles = 30, point.size = 2, line.size = 1, mainbar.y.label = "Genre Intersections", sets.x.label = "Movies Per Genre", text.scale = c(1.3, 1.3, 1, 1, 1.5, 1))
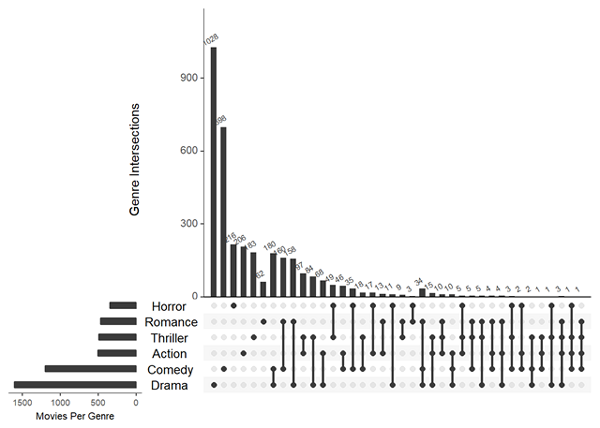
и§ЈйҮҠдёҖдёӢдёҠйқўйғЁеҲҶеҸӮж•°пјҡ
nsets: йЎҫеҗҚжҖқд№үпјҢе°ұжҳҜеұ•зӨәеҮ дёӘйӣҶеҗҲпјҢmoviesж•°жҚ®йӣҶз”ұ20еҮ дёӘйӣҶеҗҲпјҢдёҚеҸҜиғҪе…ЁйғЁеұ•зӨәпјҢеҸҰеӨ–д»ҺеӣҫдёӯеҸҜд»ҘзңӢеҮәпјҢиҝҷ6дёӘйӣҶеҗҲеә”иҜҘдёҚжҳҜжҢүйЎәеәҸйҖүжӢ©зҡ„гҖӮ
numble.angle: жҹұеӯҗдёҠзҡ„ж•°еӯ—зңӢеҲ°дәҶеҗ§пјҢиҝҷдёӘеҸӮж•°е°ұжҳҜи°ғж•ҙж•°еӯ—и§’еәҰзҡ„пјҢеҸҜжңүеҸҜж— зҡ„
mainbar.y.label/sets.x.labelпјҡеқҗж ҮиҪҙеҗҚз§°
text.scale(): жңүе…ӯдёӘж•°еӯ—пјҢеҲҶеҲ«жҺ§еҲ¶c(intersection size title, intersection size tick labels, set size title, set size tick labels, set names, numbers above bars)гҖӮ
еҫҲеӨҡж—¶еҖҷжҲ‘们жғіиҰҒзңӢзү№е®ҡзҡ„еҮ дёӘйӣҶеҗҲпјҢUpSetRж»Ўи¶іжҲ‘们зҡ„йңҖжұӮгҖӮ
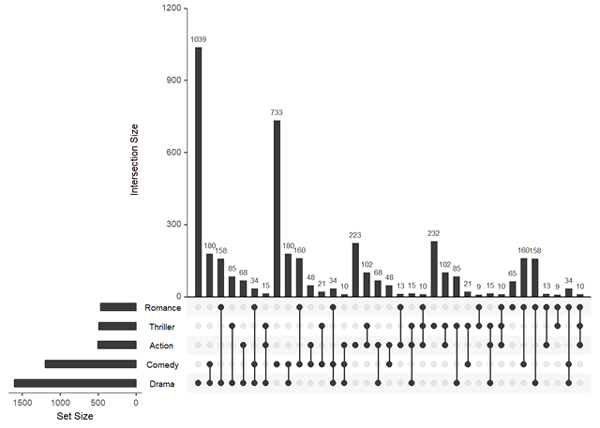
upset(movies, sets = c("Action", "Adventure", "Comedy", "Drama", "Mystery", "Thriller", "Romance", "War", "Western"), mb.ratio = c(0.55, 0.45), order.by = "freq") 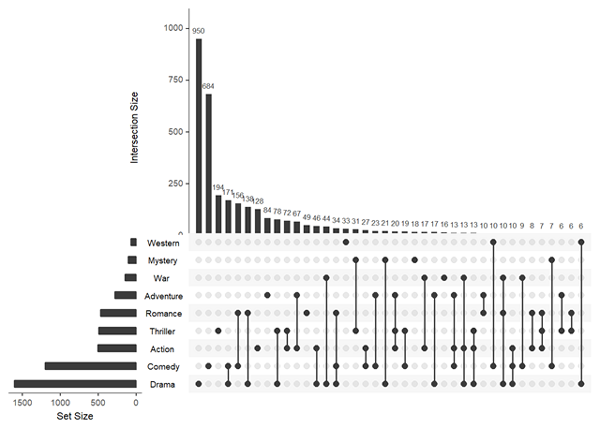
ж–Үдёӯзҡ„еҸӮж•°пјҡ
еҗ„дёӘеҸҳйҮҸд№ҹеҸҜд»ҘйҖҡиҝҮеҸӮж•°keep.orderжқҘжҺ’еәҸ
upset(movies, sets = c("Action", "Adventure", "Comedy", "Drama", "Mystery", "Thriller", "Romance", "War", "Western"), mb.ratio = c(0.55, 0.45), order.by = "freq", keep.order = TRUE) 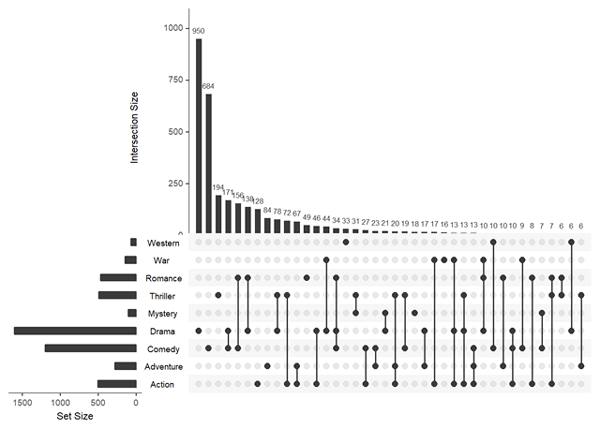
д№ҹеҸҜд»ҘжҢүgroupиҝӣиЎҢеұ•зӨәпјҢиҝҷеӣҫеұ•зӨәзҡ„е°ұжҳҜжҢүеҗ„дёӘеҸҳйҮҸиҮӘиә«гҖҒдёӨдёӘдәӨйӣҶгҖҒдёүдёӘдәӨйӣҶ…дҫқж¬Ўеұ•зӨәгҖӮеҸӮж•°cutoffжҺ§еҲ¶жҜҸдёӘgroupжҳҫзӨәеҮ дёӘдәӨйӣҶгҖӮ
еҸӮж•°intersectsжҺ§еҲ¶жҖ»е…ұжҳҫзӨәеҮ дёӘдәӨйӣҶгҖӮ
upset(movies, nintersects = 70, group.by = "sets", cutoff = 7)
иҝҳжңүеҫҲеӨҡеҸӮж•°жҜ”еҰӮжҺ§еҲ¶йўңиүІзҡ„еҸӮж•°пјҢзӮ№гҖҒзәҝеӨ§е°ҸзӯүпјҢе…·дҪ“еҸҜжҹҘзңӢ?upset
queriesеҸӮж•°
queriesеҸӮж•°еҲҶдёәеӣӣдёӘйғЁеҲҶпјҡquery, param, color, active.
query: жҢҮе®ҡе“ӘдёӘqueryпјҢUpSetRжңүеҶ…зҪ®зҡ„пјҢд№ҹеҸҜд»ҘиҮӘе®ҡд№үпјҢиҜҙеҲ°еә•е°ұжҳҜдёҖдёӘжҹҘиҜўеҮҪж•°
param: list, queryдҪңз”ЁдәҺе“ӘдёӘдәӨйӣҶ
colorпјҡжҜҸдёӘqueryйғҪжҳҜдёҖдёӘlistпјҢйҮҢйқўеҸҜд»Ҙи®ҫзҪ®йўңиүІ,жІЎи®ҫзҪ®зҡ„иҜқе°Ҷи°ғз”ЁеҢ…йҮҢй»ҳи®Өзҡ„и°ғиүІжқҝ
activeпјҡиў«жҢҮе®ҡзҡ„жқЎеҪўеӣҫжҳҜеҗҰйңҖиҰҒйўңиүІиҰҶзӣ–пјҢTRUEзҡ„иҜқжҳҫзӨәйўңиүІпјҢFALSEзҡ„иҜқеҲҷеңЁжқЎеҪўеӣҫйЎ¶з«ҜжҳҫзӨәдёүи§’еҪў
еҶ…зҪ®зҡ„intersects query
upset(movies, queries = list(list(query=intersects, params=list("Drama", "Comedy", "Action"), color="orange", active=T), list(query=intersects, params=list("Drama"), color="red", active=F), list(query=intersects, params=list("Action", "Drama"), active=T))) 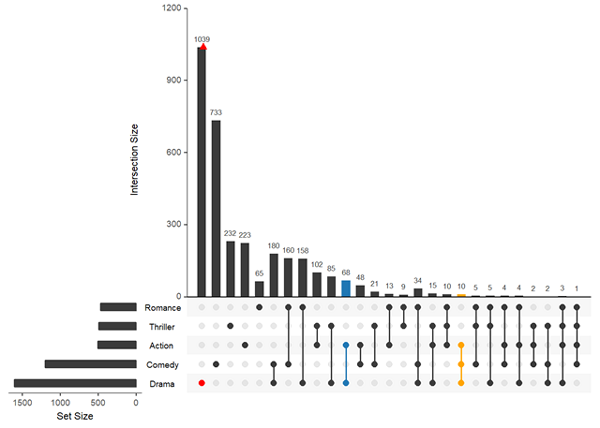
еҶ…зҪ®зҡ„elements query
жӯӨqueryеҸҜд»ҘеҸҜи§ҶеҢ–зү№е®ҡдәӨйӣҶеңЁдёҚеҗҢжқЎд»¶дёӢзҡ„жғ…еҶө
upset(movies, queries = list(list(query=elements, params=list("AvgRating", 3.5, 4.1), color="blue", active=T), list(query=elements, params=list("ReleaseDate", 1980, 1990, 2000), color="red", active=F))) 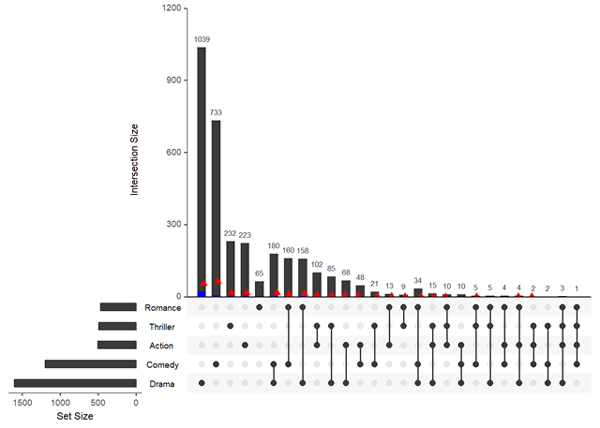
иҮӘе®ҡд№үдёҖдёӘquery
myfunc <- function(row, release, rating){ newdata <- (row["ReleaseDate"]%in%release)&(row["AvgRating"]>rating) } upset(movies, queries = list(list(query=myfunc, params=list(c(1950,1960,1990,2000), 3.0), color="red", active=T))) 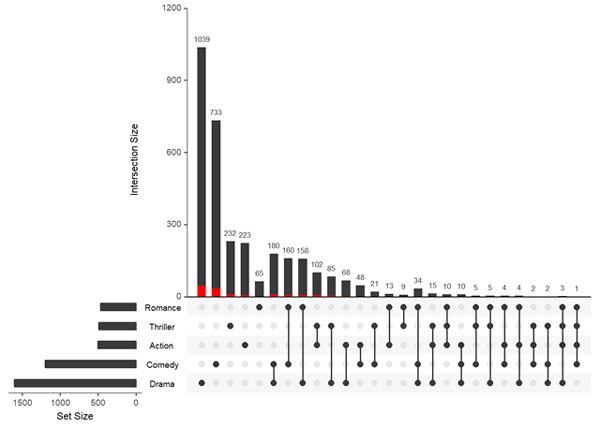
ж·»еҠ queryеӣҫдҫӢ
upset(movies, query.legend = "top", queries = list(list(query = intersects, params = list("Drama", "Comedy", "Action"), color = "orange", active = T, query.name = "Funny action"), list(query = intersects, params = list("Drama"), color = "red", active = F), list(query = intersects, params = list("Action", "Drama"), active = T, query.name = "Emotional action"))) 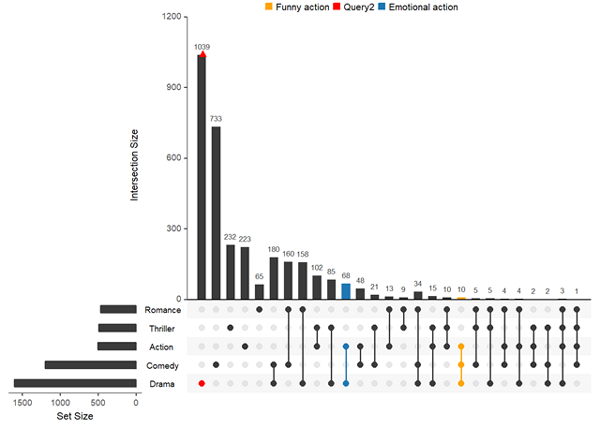
еҸӮж•°attribute.plots
дё»иҰҒжҳҜз”ЁдәҺж·»еҠ еұһжҖ§еӣҫпјҢеҶ…зҪ®жңүжҹұеҪўеӣҫгҖҒж•ЈзӮ№еӣҫгҖҒзғӯеӣҫзӯү
жҹұеҪўеӣҫ
upset(movies, main.bar.color = "black", queries = list(list(query = intersects, params = list("Drama"), active = T)), attribute.plots = list(gridrows = 50, plots = list(list(plot = histogram, x = "ReleaseDate", queries = F), list(plot = histogram, x = "AvgRating", queries = T)), ncols = 2)) 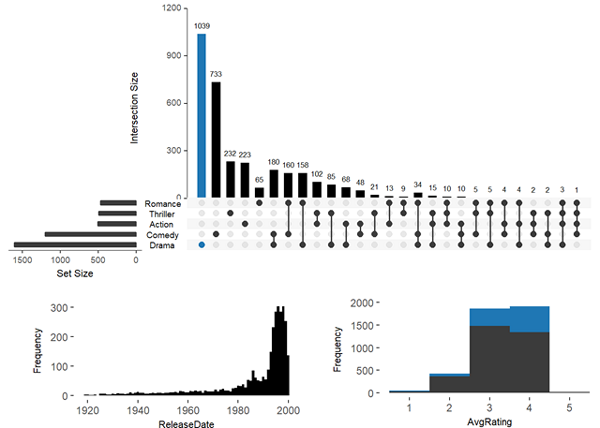
ж•ЈзӮ№еӣҫ
upset(movies, main.bar.color = "black", queries = list(list(query = intersects, params = list("Drama"), color = "red", active = F), list(query = intersects, params = list("Action", "Drama"), active = T), list(query = intersects, params = list("Drama", "Comedy", "Action"), color = "orange", active = T)), attribute.plots = list(gridrows = 45, plots = list(list(plot = scatter_plot, x = "ReleaseDate", y = "AvgRating", queries = T), list(plot = scatter_plot, x = "AvgRating", y = "Watches", queries = F)), ncols = 2), query.legend = "bottom") 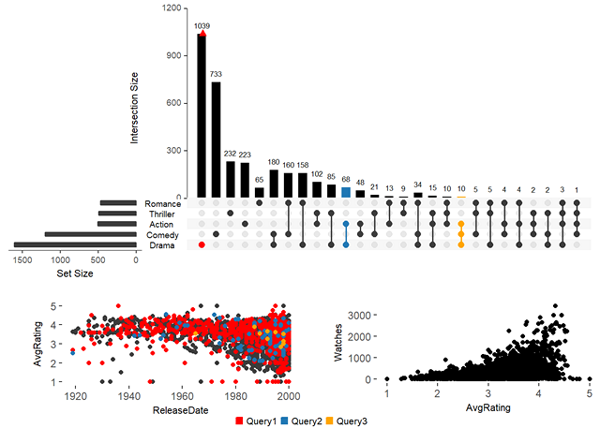
з®ұзәҝеӣҫ
з®ұзәҝеӣҫеҸҜд»Ҙеұ•зӨәж•°жҚ®зҡ„еҲҶеёғ,йҖҡиҝҮеҸӮж•°boxplot.summaryжҺ§еҲ¶пјҢжңҖеӨҡеҸҜд»ҘдёҖж¬ЎжҖ§жҳҫзӨәдёӨдёӘз®ұзәҝеӣҫ
upset(movies, boxplot.summary = c("AvgRating", "ReleaseDate")) 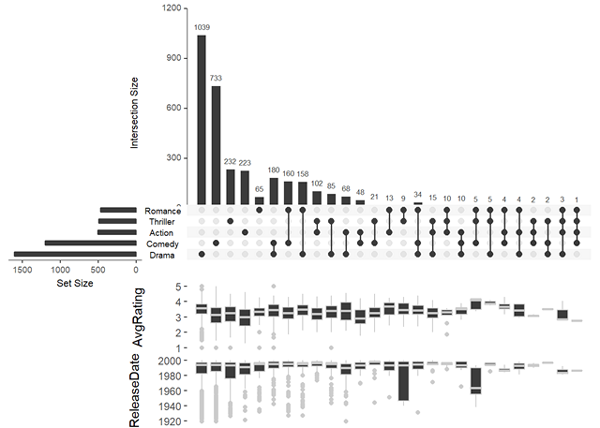
иҝҳжңүдёҖдёӘеҚҒеҲҶйҮҚиҰҒзҡ„еҠҹиғҪIncorporating Set MetadataиҝҷйҮҢе°ұдёҚи®ІдәҶгҖӮ
SessionInfo
sessionInfo() ## R version 3.4.2 (2017-09-28) ## Platform: x86_64-w64-mingw32/x64 (64-bit) ## Running under: Windows 10 x64 (build 15063) ## ## Matrix products: default ## ## locale: ## [1] LC_COLLATE=Chinese (Simplified)_China.936 ## [2] LC_CTYPE=Chinese (Simplified)_China.936 ## [3] LC_MONETARY=Chinese (Simplified)_China.936 ## [4] LC_NUMERIC=C ## [5] LC_TIME=Chinese (Simplified)_China.936 ## ## attached base packages: ## [1] stats graphics grDevices utils datasets methods base ## ## other attached packages: ## [1] UpSetR_1.3.3 ## ## loaded via a namespace (and not attached): ## [1] Rcpp_0.12.13 knitr_1.17 magrittr_1.5 munsell_0.4.3 ## [5] colorspace_1.3-2 rlang_0.1.2 stringr_1.2.0 highr_0.6 ## [9] plyr_1.8.4 tools_3.4.2 grid_3.4.2 gtable_0.2.0 ## [13] htmltools_0.3.6 yaml_2.1.14 lazyeval_0.2.0 rprojroot_1.2 ## [17] digest_0.6.12 tibble_1.3.4 gridExtra_2.3 ggplot2_2.2.1 ## [21] evaluate_0.10.1 rmarkdown_1.6 labeling_0.3 stringi_1.1.5 ## [25] compiler_3.4.2 scales_0.5.0 backports_1.1.1
вҖңRиҜӯиЁҖеҸҜи§ҶеҢ–UpSetRеҢ…жҖҺд№ҲдҪҝз”ЁвҖқзҡ„еҶ…е®№е°ұд»Ӣз»ҚеҲ°иҝҷйҮҢдәҶпјҢж„ҹи°ўеӨ§е®¶зҡ„йҳ…иҜ»гҖӮеҰӮжһңжғідәҶи§ЈжӣҙеӨҡиЎҢдёҡзӣёе…ізҡ„зҹҘиҜҶеҸҜд»Ҙе…іжіЁдәҝйҖҹдә‘зҪ‘з«ҷпјҢе°Ҹзј–е°ҶдёәеӨ§е®¶иҫ“еҮәжӣҙеӨҡй«ҳиҙЁйҮҸзҡ„е®һз”Ёж–Үз« пјҒ


