еҰӮдҪ•дҪҝз”ЁBpytopе·Ҙе…·
иҝҷзҜҮж–Үз« дё»иҰҒд»Ӣз»ҚвҖңеҰӮдҪ•дҪҝз”ЁBpytopе·Ҙе…·вҖқпјҢеңЁж—Ҙеёёж“ҚдҪңдёӯпјҢзӣёдҝЎеҫҲеӨҡдәәеңЁеҰӮдҪ•дҪҝз”ЁBpytopе·Ҙе…·й—®йўҳдёҠеӯҳеңЁз–‘жғ‘пјҢе°Ҹзј–жҹҘйҳ…дәҶеҗ„ејҸиө„ж–ҷпјҢж•ҙзҗҶеҮәз®ҖеҚ•еҘҪз”Ёзҡ„ж“ҚдҪңж–№жі•пјҢеёҢжңӣеҜ№еӨ§е®¶и§Јзӯ”вҖқеҰӮдҪ•дҪҝз”ЁBpytopе·Ҙе…·вҖқзҡ„з–‘жғ‘жңүжүҖеё®еҠ©пјҒжҺҘдёӢжқҘпјҢиҜ·и·ҹзқҖе°Ҹзј–дёҖиө·жқҘеӯҰд№ еҗ§пјҒ
Bpytop
BpytopжҳҜдёҖж¬ҫеҠҹиғҪејәеӨ§зҡ„Linux/OSX/FreeBSDиө„жәҗзӣ‘жҺ§е·Ҙе…·пјҢиҜҘе·Ҙе…·еҸҜд»ҘжҳҫзӨәзӣ®ж Үзі»з»ҹдёӯзҡ„иө„жәҗз”ЁйҮҸе’ҢеӨ„зҗҶеҷЁзҠ¶жҖҒпјҢе…¶дёӯеҢ…жӢ¬еҶ…еӯҳз”ЁйҮҸгҖҒзЈҒзӣҳз©әй—ҙгҖҒзҪ‘з»ңжөҒйҮҸе’ҢиҝӣзЁӢзҠ¶жҖҒгҖӮ
еҠҹиғҪд»Ӣз»Қ
жҳ“дәҺдҪҝз”ЁпјҢеёҰжңүдёҖдёӘдәӨдә’жҖ§жһҒејәзҡ„иҸңеҚ•зі»з»ҹпјӣ
е®Ңж•ҙзҡ„йј ж Үж”ҜжҢҒпјҢжүҖжңүзҡ„жҢүй’®йғҪй«ҳдә®жҳҫзӨә并且еҸҜзӮ№еҮ»пјҢиҝҳж”ҜжҢҒйј ж Үж»ҡеҠЁиҝӣзЁӢеҲ—иЎЁд»ҘеҸҠиҸңеҚ•ж Ҹпјӣ
еҝ«йҖҹе“Қеә”ејҸUIпјҢеҸҜдҪҝз”Ёе°Ҹй”®зӣҳдёҠдёӢй”®еҲҮжҚўиҝӣзЁӢпјӣ
еҸҜжҳҫзӨәйҖүдёӯиҝӣзЁӢзҡ„е®Ңж•ҙзҠ¶жҖҒдҝЎжҒҜпјӣ
ж”ҜжҢҒиҝҮж»ӨиҝӣзЁӢпјҢж”ҜжҢҒеӨҡйҮҚиҝҮж»Өпјӣ
еҸҜиҪ»жқҫеҲҮжҚўжҺ’еәҸйҖүйЎ№пјӣ
еҸҜеҗ‘йҖүдёӯиҝӣзЁӢеҸ‘йҖҒSIGTERMгҖҒSIGKILLе’ҢSIGINTпјӣ
жҸҗдҫӣдәҶUIиҸңеҚ•жқҘдҝ®ж”№жүҖжңүзҡ„й…ҚзҪ®ж–Ү件пјӣ
иҮӘеҠЁз”ҹжҲҗеҸҜзј©ж”ҫзҡ„зҪ‘з»ңз”ЁйҮҸеӣҫпјӣ
еҰӮжһңжЈҖжөӢеҲ°дәҶж–°зүҲжң¬пјҢеҲҷдјҡеңЁе·Ҙе…·иҸңеҚ•дёӯжҳҫзӨәпјӣ
жҳҫзӨәзЈҒзӣҳеҪ“еүҚзҡ„иҜ»еҶҷйҖҹеәҰпјӣ
дё»йўҳж”ҜжҢҒ
BpytopдҪҝз”Ёзҡ„дё»йўҳж–Ү件и·ҹbashtopзӣёеҗҢпјҢжүҖд»Ҙbashtopж”ҜжҢҒзҡ„дё»йўҳж–Ү件Bpytopд№ҹеҸҜд»ҘдҪҝз”ЁгҖӮзӮ№еҮ»гҖҗиҝҷйҮҢгҖ‘жҹҘзңӢжүҖжңүж”ҜжҢҒзҡ„дё»йўҳж–Ү件гҖӮ
еҰӮжһңдҪҝз”Ёmake installе‘Ҫд»Өе®үиЈ…зҡ„иҜқпјҢдё»йўҳж–Ү件дјҡй»ҳи®Өеӯҳж”ҫеңЁ/usr/local/share/bpytop/themesдёӯгҖӮеҰӮжһңдҪҝз”Ёpip3е‘Ҫд»Өе®үиЈ…зҡ„иҜқпјҢдё»йўҳе°Ҷдјҡеӯҳж”ҫеңЁдёҖдёӘеҗҚдёәbpytop-themesзҡ„зӣ®еҪ•дёӢгҖӮз”ЁжҲ·иҮӘе·ұеҲӣе»әзҡ„дё»йўҳеә”иҜҘеӯҳж”ҫеңЁ$HOME/.config/bpytop/themesи·Ҝеҫ„дёӢгҖӮ
е·Ҙе…·дҫқиө–
е·Ҙе…·е®үиЈ…
PyPiпјҲеҸӘе®үиЈ…жңҖж–°зүҲжң¬пјү
pip3 install bpytop --upgrade
Arch Linux
https://aur.archlinux.org/packages/bpytop/
Debian
sudo apt install bpytop
FreeBSDеҢ…
sudo pkg install bpytop
Fedora/CenOS 8еҢ…
sudo dnf install bpytop
Gentoo/Calculate Linux
sudo emerge -av sys-process/bpytop
Mageia CauldronпјҲMageia 8пјү
sudo urpmi bpytop

sudo dnf install bpytop
MX Linux
http://mxrepo.com/mx/testrepo/pool/test/b/bpytop/
жүӢеҠЁе®үиЈ…
git clone https://github.com/aristocratos/bpytop.git

cd bpytop

sudo make install
е·Ҙе…·еҚёиҪҪ
sudo make uninstall
е·Ҙе…·й…ҚзҪ®
иҜҘе·Ҙе…·жүҖжңүзҡ„й…ҚзҪ®йҖүйЎ№йғҪеҸҜд»ҘйҖҡиҝҮUIз•ҢйқўжқҘиҝӣиЎҢй…ҚзҪ®е’Ңдҝ®ж”№пјҢе…¶дёӯзҡ„й…ҚзҪ®ж–Ү件еӯҳеӮЁеңЁ"$HOME/.config/bpytop"зӣ®еҪ•дёӯгҖӮй…ҚзҪ®ж–Ү件е°ҶиҮӘеҠЁз”ҹжҲҗпјҢж–Ү件еҗҚдёәbpytop.cfgпјҲ/etc/bpytop.confе°ҶдҪңдёәй…ҚзҪ®ж–Ү件з”ҹжҲҗзҡ„й»ҳи®Өз§Қеӯҗпјүпјҡ
#? Config file for bpytop v. 1.0.22


#* Color theme, looks for a .theme file in "/usr/[local/]share/bpytop/themes" and "~/.config/bpytop/themes", "Default" for builtin default theme.

#* Prefix name by a plus sign (+) for a theme located in user themes folder, i.e. color_theme="+monokai"

color_theme="Default"


#* If the theme set background should be shown, set to False if you want terminal background transparency

theme_background=False


#* Set bpytop view mode, "full" for everything shown, "proc" for cpu stats and processes, "stat" for cpu, mem, disks and net stats shown.

view_mode=full


#* Update time in milliseconds, increases automatically if set below internal loops processing time, recommended 2000 ms or above for better sample times for graphs.

update_ms=2000


#* Processes sorting, "pid" "program" "arguments" "threads" "user" "memory" "cpu lazy" "cpu responsive",

#* "cpu lazy" updates top process over time, "cpu responsive" updates top process directly.

proc_sorting="cpu lazy"


#* Reverse sorting order, True or False.

proc_reversed=False


#* Show processes as a tree

proc_tree=False


#* Use the cpu graph colors in the process list.

proc_colors=True


#* Use a darkening gradient in the process list.

proc_gradient=True


#* If process cpu usage should be of the core it's running on or usage of the total available cpu power.

proc_per_core=True


#* Show process memory as bytes instead of percent

proc_mem_bytes=True


#* Check cpu temperature, needs "osx-cpu-temp" on MacOS X.

check_temp=True


#* Draw a clock at top of screen, formatting according to strftime, empty string to disable.

draw_clock="%X"


#* Update main ui in background when menus are showing, set this to false if the menus is flickering too much for comfort.

background_update=True


#* Custom cpu model name, empty string to disable.

custom_cpu_name=""


#* Optional filter for shown disks, should be last folder in path of a mountpoint, "root" replaces "/", separate multiple values with comma.

#* Begin line with "exclude=" to change to exclude filter, oterwise defaults to "most include" filter. Example: disks_filter="exclude=boot, home"

disks_filter=""


#* Show graphs instead of meters for memory values.

mem_graphs=True


#* If swap memory should be shown in memory box.

show_swap=True


#* Show swap as a disk, ignores show_swap value above, inserts itself after first disk.

swap_disk=True


#* If mem box should be split to also show disks info.

show_disks=True


#* Set fixed values for network graphs, default "10M" = 10 Mibibytes, possible units "K", "M", "G", append with "bit" for bits instead of bytes, i.e "100mbit"

net_download="100Mbit"

net_upload="100Mbit"


#* Start in network graphs auto rescaling mode, ignores any values set above and rescales down to 10 Kibibytes at the lowest.

net_auto=True


#* Sync the scaling for download and upload to whichever currently has the highest scale

net_sync=False


#* If the network graphs color gradient should scale to bandwith usage or auto scale, bandwith usage is based on "net_download" and "net_upload" values

net_color_fixed=False


#* Show init screen at startup, the init screen is purely cosmetical

show_init=False


#* Enable check for new version from github.com/aristocratos/bpytop at start.

update_check=True


#* Set loglevel for "~/.config/bpytop/error.log" levels are: "ERROR" "WARNING" "INFO" "DEBUG".

#* The level set includes all lower levels, i.e. "DEBUG" will show all logging info.

log_level=WARNING
е‘Ҫд»ӨиЎҢйҖүйЎ№
USAGE: bpytop [argument]


Arguments:

    -f, --full            Start in full mode showing all boxes [default]

    -p, --proc            Start in minimal mode without memory and net boxes

    -s, --stat            Start in minimal mode without process box

    -v, --version         Show version info and exit

    -h, --help            Show this help message and exit

    --debug               Start with loglevel set to DEBUG overriding value set in config
е·Ҙе…·иҝҗиЎҢжҲӘеӣҫ
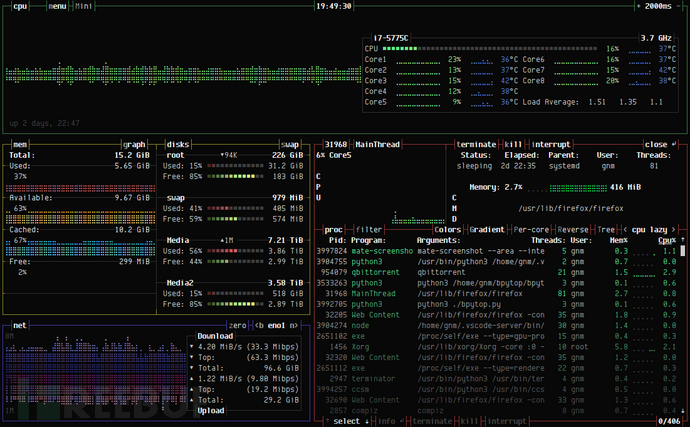
е·Ҙе…·дё»з•Ңйқўе°ҶжҳҫзӨәйҖүдёӯиҝӣзЁӢзҡ„иө„жәҗдҪҝз”Ёжғ…еҶөпјҡ
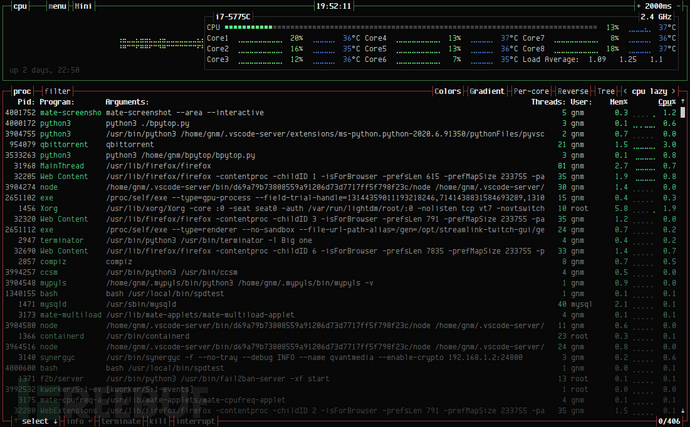
дё»з•Ңйқўзҡ„иҝ·дҪ жЁЎејҸпјҡ
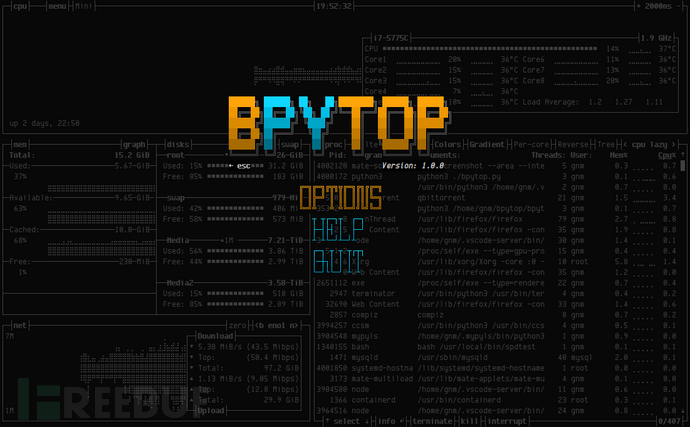
е·Ҙе…·дё»иҸңеҚ•пјҡ
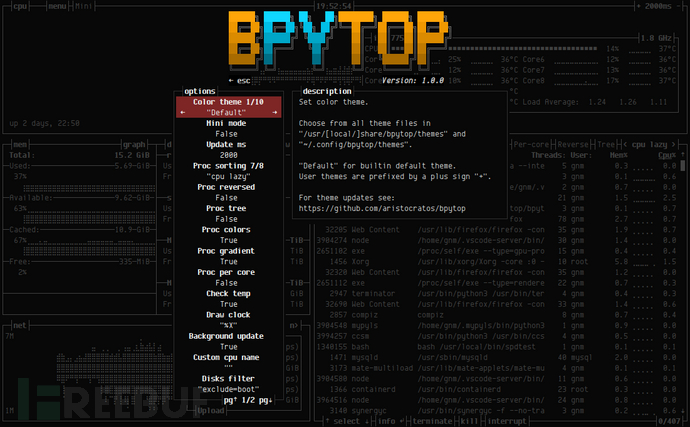
е·Ҙе…·йҖүйЎ№иҸңеҚ•пјҡ
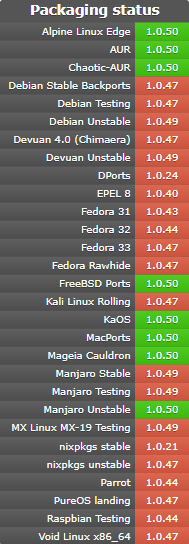
дҫқиө–еҢ…зүҲжң¬
еҲ°жӯӨпјҢе…ідәҺвҖңеҰӮдҪ•дҪҝз”ЁBpytopе·Ҙе…·вҖқзҡ„еӯҰд№ е°ұз»“жқҹдәҶпјҢеёҢжңӣиғҪеӨҹи§ЈеҶіеӨ§е®¶зҡ„з–‘жғ‘гҖӮзҗҶи®әдёҺе®һи·өзҡ„жҗӯй…ҚиғҪжӣҙеҘҪзҡ„её®еҠ©еӨ§е®¶еӯҰд№ пјҢеҝ«еҺ»иҜ•иҜ•еҗ§пјҒиӢҘжғіз»§з»ӯеӯҰд№ жӣҙеӨҡзӣёе…ізҹҘиҜҶпјҢиҜ·з»§з»ӯе…іжіЁдәҝйҖҹдә‘зҪ‘з«ҷпјҢе°Ҹзј–дјҡ继з»ӯеҠӘеҠӣдёәеӨ§е®¶еёҰжқҘжӣҙеӨҡе®һз”Ёзҡ„ж–Үз« пјҒ


