本篇内容介绍了“Java怎么获取线程状态及堆栈信息”的有关知识,在实际案例的操作过程中,不少人都会遇到这样的困境,接下来就让小编带领大家学习一下如何处理这些情况吧!希望大家仔细阅读,能够学有所成!
出现内存泄漏或者运行缓慢场景,有时候无法直接从业务日志看出问题时候,需要分析jvm内存和线程堆栈
线程堆栈信息主要记录jvm线程在某时刻线程执行情况,分析线程状态可以跟踪到程序出问题的地方

内存堆栈信息主要记录jvm堆中在某时刻对象使用情况,主要用于跟踪是哪个对象占用了太多的空间,从而跟踪导致内存泄漏的地方
actuator
1.x
http://host:port/metrics/threads //当前进程的线程数
http://host:port/metrics/threads.daemon  //当前进程后台驻留线程数
http://host:port/metrics/threads.peak  //当前进程线程数峰值
2.x
http://host:port/actuator/metrics/jvm.threads.daemon  //当前进程后台驻留线程数
http://host:port/actuator/metrics/jvm.threads.live  //当前进程的线程数
http://host:port/actuator/metrics/jvm.threads.peak  //当前进程线程数峰值
hystrix 线程状态
如果接入了turbine可以直接通过turbine查看整个集群状态
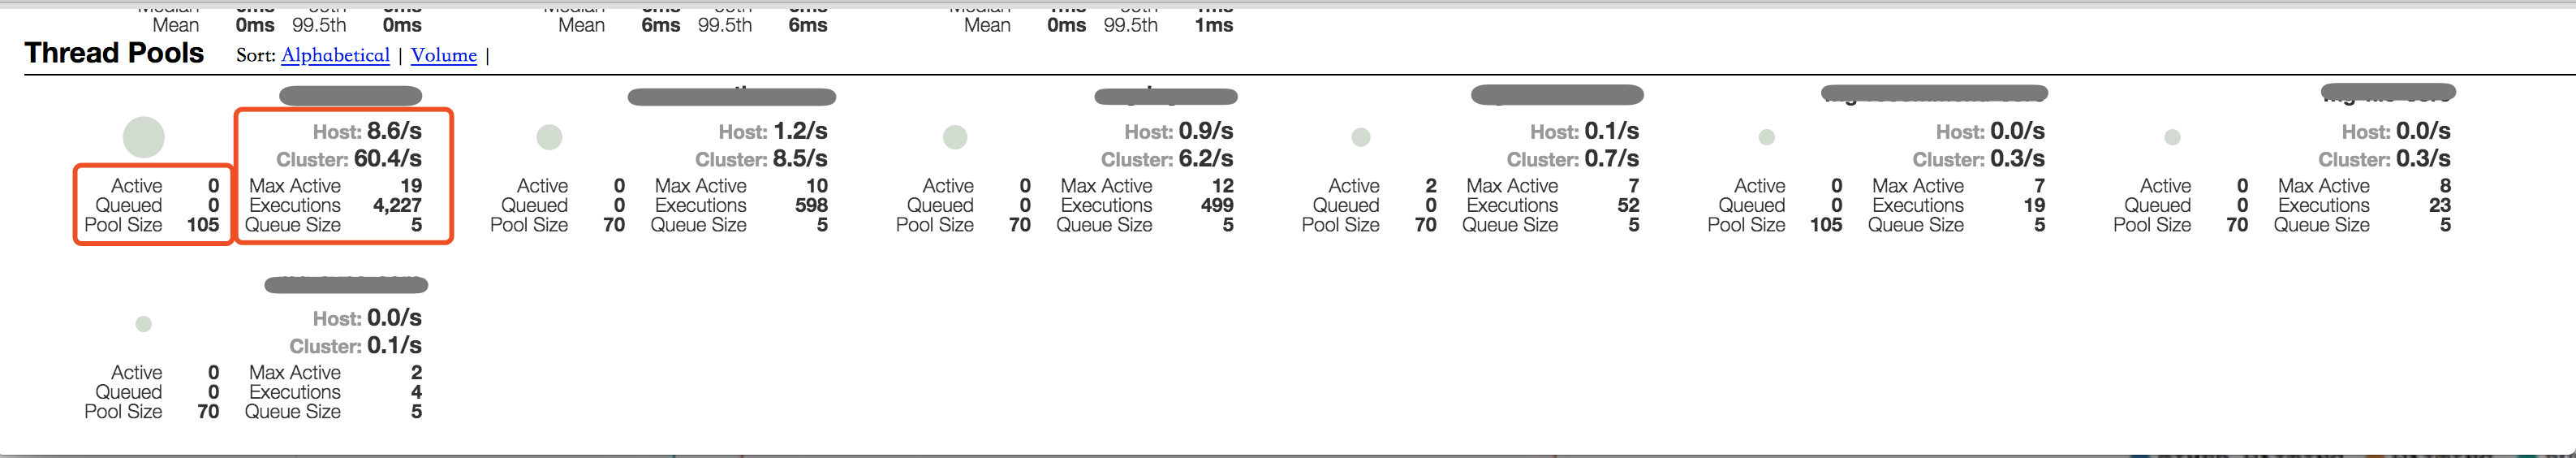
当集群较大的时候,单纯想看hystrix线程池状态,可以单独从hystrix监控统计类里面获取
http://host:port/sys/hystrix/threads
源码如下:
import com.alibaba.fastjson.JSON;
import com.netflix.hystrix.HystrixThreadPoolMetrics;
import org.slf4j.Logger;
import org.slf4j.LoggerFactory;
import org.springframework.jmx.export.annotation.ManagedResource;
import org.springframework.scheduling.annotation.EnableScheduling;
import org.springframework.scheduling.annotation.Scheduled;
import org.springframework.web.bind.annotation.GetMapping;
import org.springframework.web.bind.annotation.RequestMapping;
import org.springframework.web.bind.annotation.RestController;

import java.util.List;
import java.util.stream.Collectors;

/**
 * @author yugj
 * @date 19/5/5 22:17.
 */
@RestController
@RequestMapping(path = "/sys/hystrix")
@ManagedResource(description = "hystrix Endpoint")
@EnableScheduling
public class HystrixThreadPoolEndpoint {

    private boolean showStats = false;

    private static final Logger log = LoggerFactory.getLogger(HystrixThreadPoolEndpoint.class);


    @GetMapping(value = "/threads")
    public List<HystrixThreadStats> threadStats() {

        return HystrixThreadPoolMetrics.getInstances().stream().map((m) -> {

            final HystrixThreadStats stats = new HystrixThreadStats();
            stats.poolName = m.getThreadPoolKey().name();
            stats.cumulativeExecuted = m.getCumulativeCountThreadsExecuted();
            stats.currentActiveCount = m.getCurrentActiveCount().intValue();
            stats.currentCompletedCount = m.getCurrentCompletedTaskCount().intValue();
            stats.currentCorePoolSize = m.getCurrentCorePoolSize().intValue();
            stats.currentLargestPoolSize = m.getCurrentLargestPoolSize().intValue();
            stats.currentMaxPoolSize = m.getCurrentMaximumPoolSize().intValue();
            stats.currentPoolSize = m.getCurrentPoolSize().intValue();
            stats.currentQueueSize = m.getCurrentQueueSize().intValue();
            stats.currentTaskCount = m.getCurrentTaskCount().intValue();

            return stats;
        }).collect(Collectors.toList());
    }

    @GetMapping(value = "/setShowStats")
    public String setShowStats(Boolean showStats) {

        if (showStats != null) {
            this.showStats = showStats;
        }

        return "this.show stats:" + this.showStats;
    }

    @Scheduled(fixedRate = 5000)
    public void showStats() {

        if (showStats) {
            List<HystrixThreadPoolEndpoint.HystrixThreadStats> statsList = threadStats();
            log.info("thread stats :{}", JSON.toJSONString(statsList));
        }
    }

    class HystrixThreadStats {
        private String poolName;
        private Long cumulativeExecuted;
        private Integer currentActiveCount;
        private Integer currentCompletedCount;
        private Integer currentCorePoolSize;
        private Integer currentLargestPoolSize;
        private Integer currentMaxPoolSize;
        private Integer currentPoolSize;
        private Integer currentQueueSize;
        private Integer currentTaskCount;

        public String getPoolName() {
            return poolName;
        }

        public void setPoolName(String poolName) {
            this.poolName = poolName;
        }

        public Long getCumulativeExecuted() {
            return cumulativeExecuted;
        }

        public void setCumulativeExecuted(Long cumulativeExecuted) {
            this.cumulativeExecuted = cumulativeExecuted;
        }

        public Integer getCurrentActiveCount() {
            return currentActiveCount;
        }

        public void setCurrentActiveCount(Integer currentActiveCount) {
            this.currentActiveCount = currentActiveCount;
        }

        public Integer getCurrentCompletedCount() {
            return currentCompletedCount;
        }

        public void setCurrentCompletedCount(Integer currentCompletedCount) {
            this.currentCompletedCount = currentCompletedCount;
        }

        public Integer getCurrentCorePoolSize() {
            return currentCorePoolSize;
        }

        public void setCurrentCorePoolSize(Integer currentCorePoolSize) {
            this.currentCorePoolSize = currentCorePoolSize;
        }

        public Integer getCurrentLargestPoolSize() {
            return currentLargestPoolSize;
        }

        public void setCurrentLargestPoolSize(Integer currentLargestPoolSize) {
            this.currentLargestPoolSize = currentLargestPoolSize;
        }

        public Integer getCurrentMaxPoolSize() {
            return currentMaxPoolSize;
        }

        public void setCurrentMaxPoolSize(Integer currentMaxPoolSize) {
            this.currentMaxPoolSize = currentMaxPoolSize;
        }

        public Integer getCurrentPoolSize() {
            return currentPoolSize;
        }

        public void setCurrentPoolSize(Integer currentPoolSize) {
            this.currentPoolSize = currentPoolSize;
        }

        public Integer getCurrentQueueSize() {
            return currentQueueSize;
        }

        public void setCurrentQueueSize(Integer currentQueueSize) {
            this.currentQueueSize = currentQueueSize;
        }

        public Integer getCurrentTaskCount() {
            return currentTaskCount;
        }

        public void setCurrentTaskCount(Integer currentTaskCount) {
            this.currentTaskCount = currentTaskCount;
        }
    }

}
linux
ps huH p {pid}|wc -l当服务cup飙升或者出问题需要从主机层面定位时候,使用top -c 命令查看对应哪个进程占用了过高资源
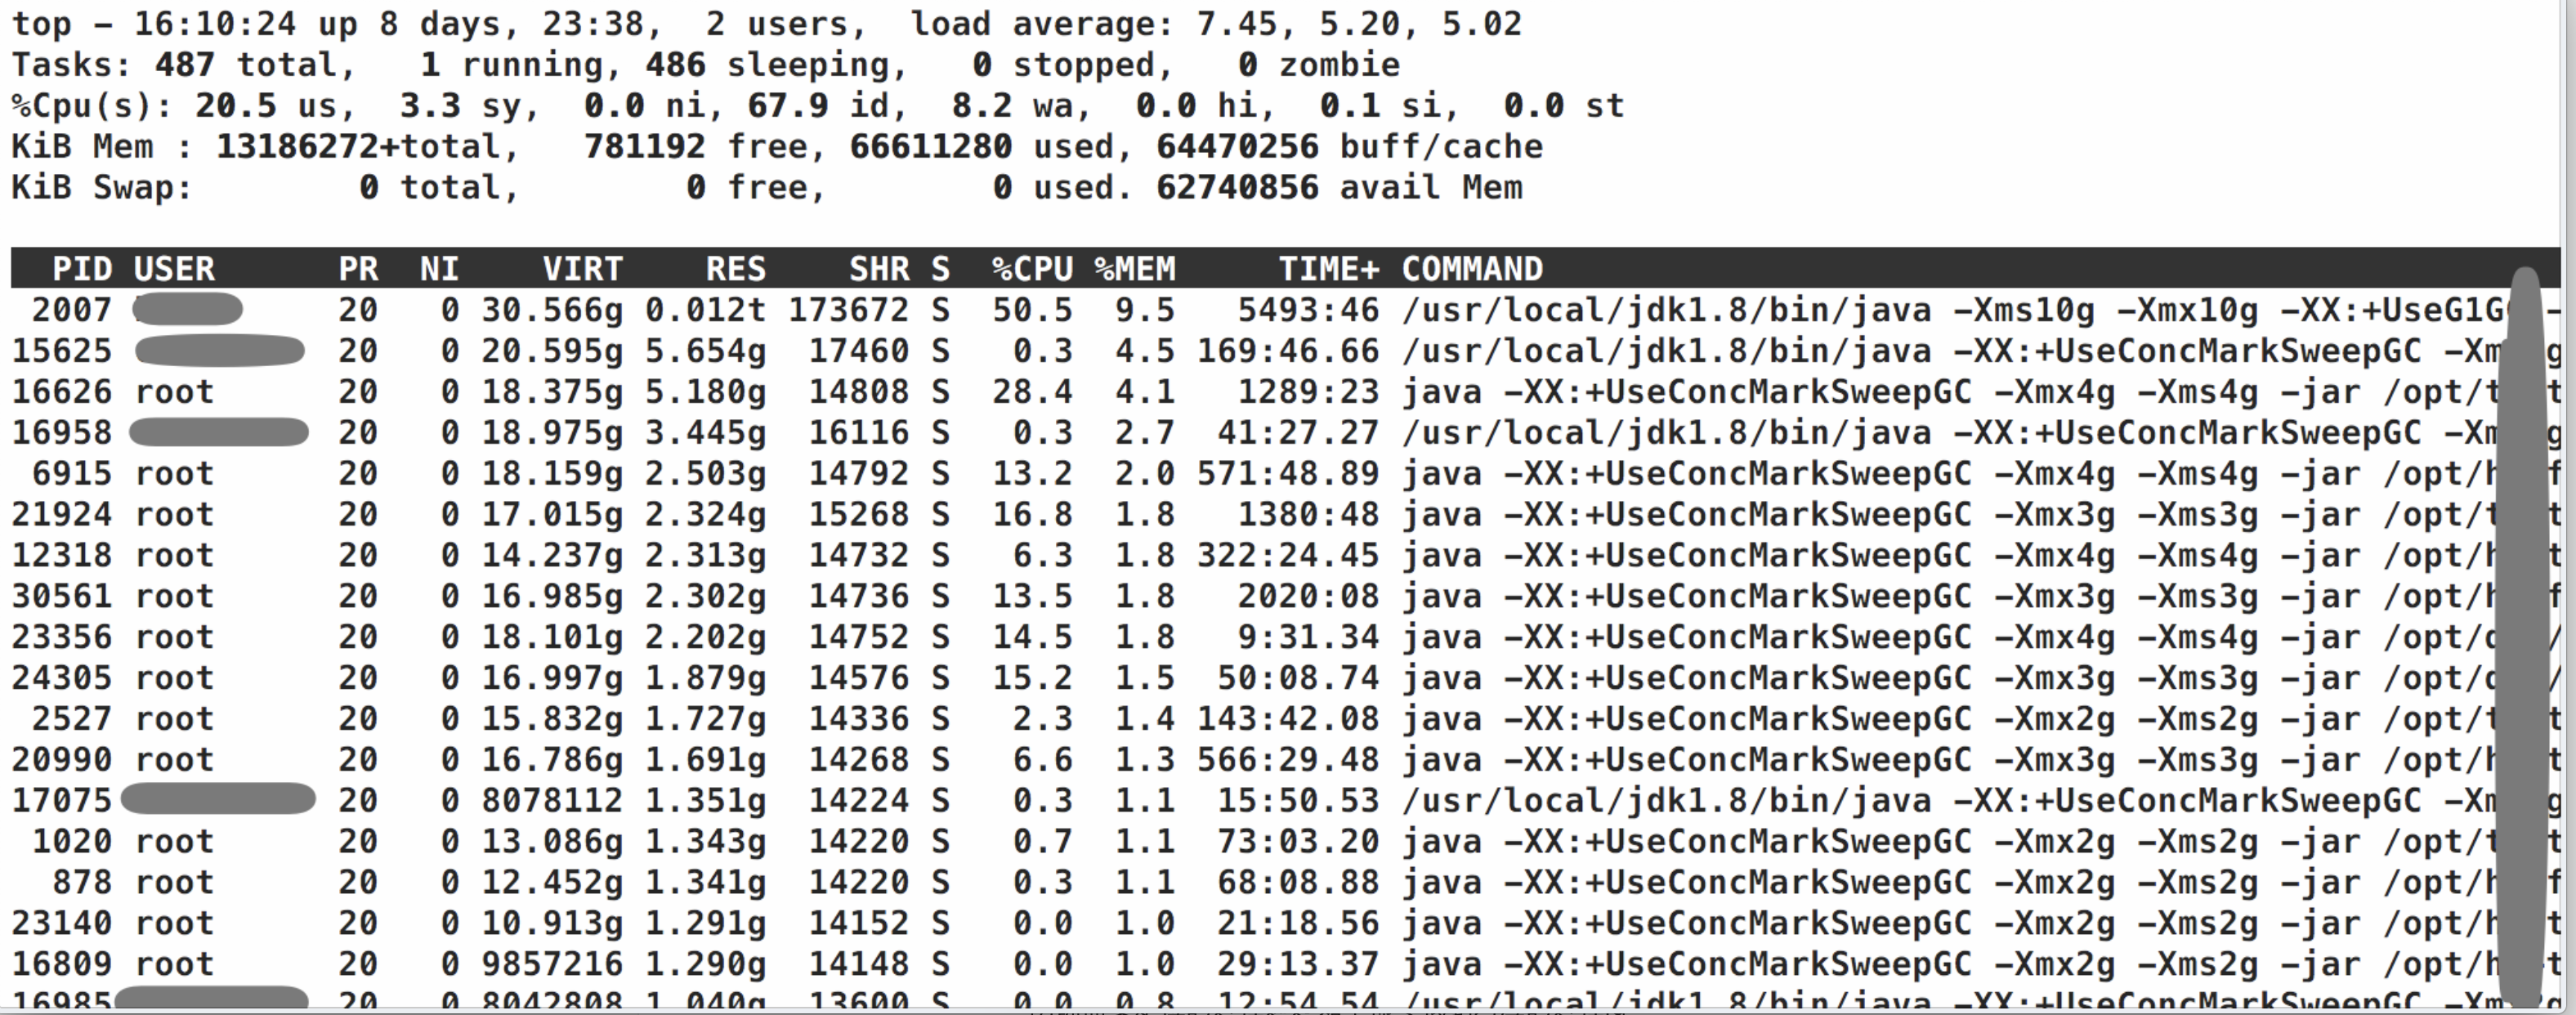
找到资源占用高的进程
明确需要定位的进程通过如下命令找到对应的进程id
ps aux|grep {application alias}可以通过如下命令定位具体高load线程:
查询进程具体哪个线程占用高load
top -Hp {进程pid}

thread id为十六进制格式转十六进制值
printf %x {线程pid}

指定特定行数堆栈信息
jstack {进程id}|grep -A 200 {线程id}
接下来通过jstack导出对应的线程堆栈
jstack 对应参数如下
-m to print both java and native frames (mixed mode)
-l long listing. Prints additional information about locks
服务器线程相对较多,文件大小较大,一般不会考虑在服务器看,另外这样查也会导致忽略了一些统计信息
通过如下命令导出文件,下载到本地查
jstack -l {pid} >> {dump-file-path}docker环境涉及一些权限,需要进入docker执行,docker里面进程id根据实际情况,一般会联系运维操作
“Java怎么获取线程状态及堆栈信息”的内容就介绍到这里了,感谢大家的阅读。如果想了解更多行业相关的知识可以关注亿速云网站,小编将为大家输出更多高质量的实用文章!
免责声明:本站发布的内容(图片、视频和文字)以原创、转载和分享为主,文章观点不代表本网站立场,如果涉及侵权请联系站长邮箱:is@yisu.com进行举报,并提供相关证据,一经查实,将立刻删除涉嫌侵权内容。


