怎么在Python 中使用Pandas实现箱线图?很多新手对此不是很清楚,为了帮助大家解决这个难题,下面小编将为大家详细讲解,有这方面需求的人可以来学习下,希望你能有所收获。
各国家用户消费分布
import numpy as np

import pandas as pd

import matplotlib.pyplot as plt


data = {

  'China': [1000, 1200, 1300, 1400, 1500, 1600, 1700, 1800, 1900, 2500],

  'America': [1200, 1300, 1400, 1500, 1600, 1700, 1800, 1900, 2000, 2100],

  'Britain': [1000, 1200, 1300, 1400, 1500, 1600, 1700, 1800, 1900, 2000],

  "Russia": [800, 1000, 1200, 1300, 1400, 1500, 1600, 1700, 1800, 1900]

}

df = pd.DataFrame(data)


# df.plot.box(title="Consumer spending in each country", vert=False)

df.plot.box(title="Consumer spending in each country")


plt.grid(line, alpha=0.3)

plt.show() 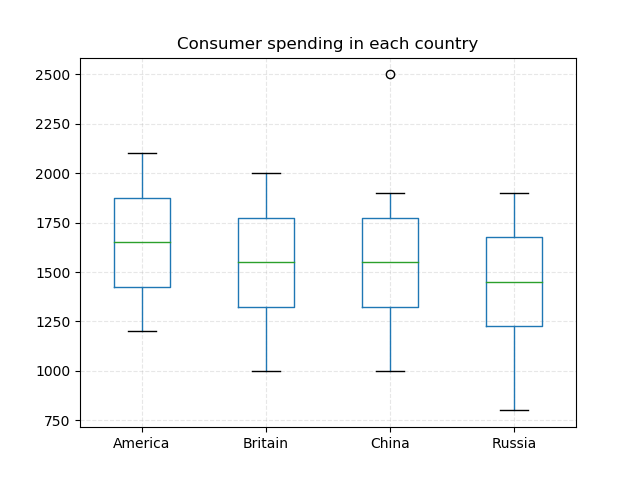
import numpy as np

import pandas as pd

import matplotlib.pyplot as plt


data = {

  'China': [1000, 1200, 1300, 1400, 1500, 1600, 1700, 1800, 1900, 2500],

  'America': [1200, 1300, 1400, 1500, 1600, 1700, 1800, 1900, 2000, 2100],

  'Britain': [1000, 1200, 1300, 1400, 1500, 1600, 1700, 1800, 1900, 2000],

  "Russia": [800, 1000, 1200, 1300, 1400, 1500, 1600, 1700, 1800, 1900]

}

df = pd.DataFrame(data)


from pandas.plotting import table


fig, ax = plt.subplots(1, 1)


table(ax, np.round(df.describe(), 2),

   loc='upper right',

   colWidths=[0.1, 0.1, 0.1, 0.1]

   )


# df.plot.box(title="Consumer spending in each country", vert=False)

df.plot.box(title="Consumer spending in each country",

      ax=ax,

      ylim=(750, 3000))


plt.grid(line, alpha=0.3)

plt.show()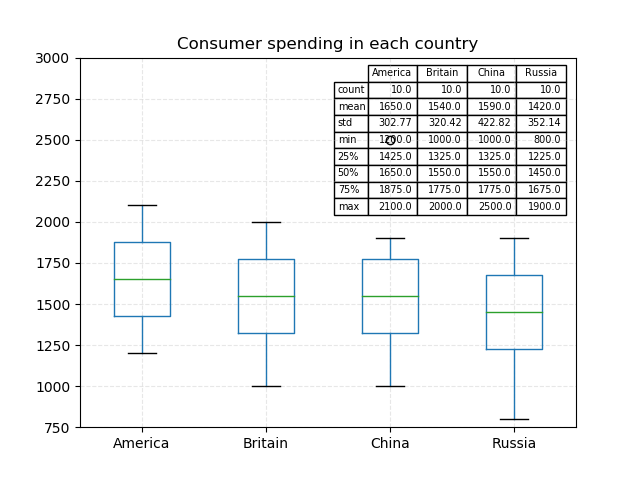
import numpy as np

import pandas as pd

import matplotlib.pyplot as plt


data = {"gender": [1, 0, 1, 0, 1, 0, 1, 0, 1, 0],

    'China': [1000, 1200, 1300, 1400, 1500, 1600, 1700, 1800, 1900, 2500],

    'America': [1200, 1300, 1400, 1500, 1600, 1700, 1800, 1900, 2000, 2100]

    }

df = pd.DataFrame(data)


# df.boxplot(column=["China", "America"], by="gender",vert=False)

df.boxplot(column=["China", "America"], by="gender")


plt.grid(line, alpha=0.3)

plt.show() 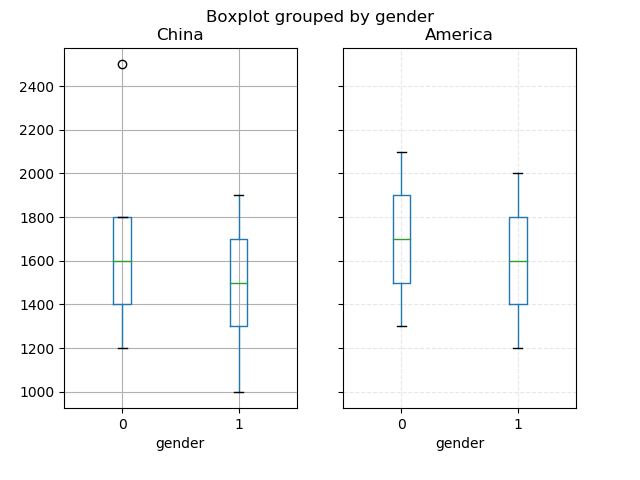
看完上述内容是否对您有帮助呢?如果还想对相关知识有进一步的了解或阅读更多相关文章,请关注亿速云行业资讯频道,感谢您对亿速云的支持。
免责声明:本站发布的内容(图片、视频和文字)以原创、转载和分享为主,文章观点不代表本网站立场,如果涉及侵权请联系站长邮箱:is@yisu.com进行举报,并提供相关证据,一经查实,将立刻删除涉嫌侵权内容。


