怎么在python中使用pandas绘制趋势图?相信很多没有经验的人对此束手无策,为此本文总结了问题出现的原因和解决方法,通过这篇文章希望你能解决这个问题。
准备环境
python3 -m venv venv
source ./venv/bin/activate
pip install pandas
pip install pandas_datareader
pip install matplotlib
代码如下
绘制 2019 年到今天2019-02-15 的我司 ( Cisco ) 的股票趋势 ( open:开盘价, close: 收盘价, high 最高价:, low: 最低价,单位为美元)
$ vi stock.py
import matplotlib.pyplot as plt
import pandas as pd
pd.core.common.is_list_like = pd.api.types.is_list_like
import pandas_datareader.data as web
import matplotlib
import time
import matplotlib.pyplot as plt
import argparse
def drawStockTrend(inc, startDate, endDate, pngFile):
fig = matplotlib.pyplot.gcf()
fig.set_size_inches(18.5, 10.5)
df = web.DataReader(name=inc, data_source='iex', start=startDate, end=endDate)
print(df)
plt.style.use('seaborn-whitegrid')
plt.xticks(rotation=30)
plt.plot(df.index, df['open'], label='open', marker='o', linestyle=':', linewidth=1, markersize=3, color='gray')
plt.plot(df.index, df['high'], label='high', marker='o', linestyle=':', linewidth=1, markersize=3, color='green')
plt.plot(df.index, df['low'], label='low', marker='o', linestyle=':', linewidth=1, markersize=3, color='blue')
plt.plot(df.index, df['close'], label='close', marker='o', linestyle='-', linewidth=2, markersize=6, color='red')
for x, y in zip(df.index, df['close']):
plt.text(x, y + 0.3, '%.2f' % y, ha='center', va='bottom', color='red')
plt.legend()
plt.title("%s' stock trend" % company)
plt.show(block=True)
time.sleep(1)
if(not pngFile):
fig.savefig(pngFile)
plt.close()
if __name__ == "__main__":
parser = argparse.ArgumentParser()
parser.add_argument('-c', action='store', dest='company', help='specify company')
parser.add_argument('-s', action='store', dest='start', help='specify start date')
parser.add_argument('-e', action='store', dest='end', help='specify end date')
parser.add_argument('-f', action='store', dest='file', help='specify the filename')
args = parser.parse_args()
company = 'CSCO'
startDate = '2019-01-01'
endDate = '2019-02-19'
pngFile = None
if(args.company):
company = args.company
if (args.start):
startDate = args.start
if (args.end):
endDate = args.end
if (args.file):
pngFile = args.file
drawStockTrend(company, startDate, endDate, pngFile)
#example
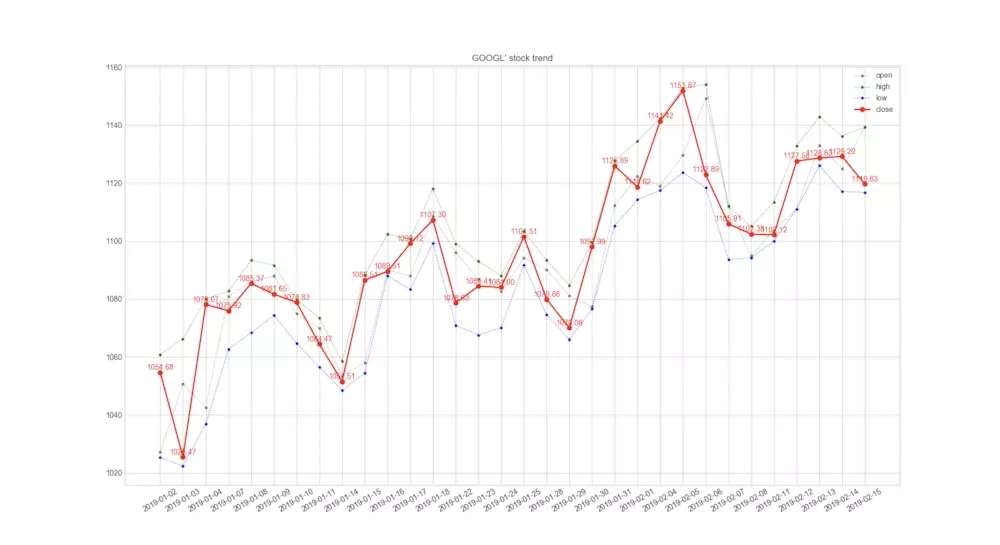
# python stock.py -c GOOGL -s 2019-01-01 -e 2019-02-19 -f google_stock_trend.png
# python stock.py -c CSCO -s 2019-01-01 -e 2019-02-19 -f cisco_stock_trend.png
# python stock.py -c SINA -s 2019-01-01 -e 2019-02-19 -f sina_stock_trend.png
# python stock.py -c BIDU -s 2019-01-01 -e 2019-02-19 -f baidu_stock_trend.png
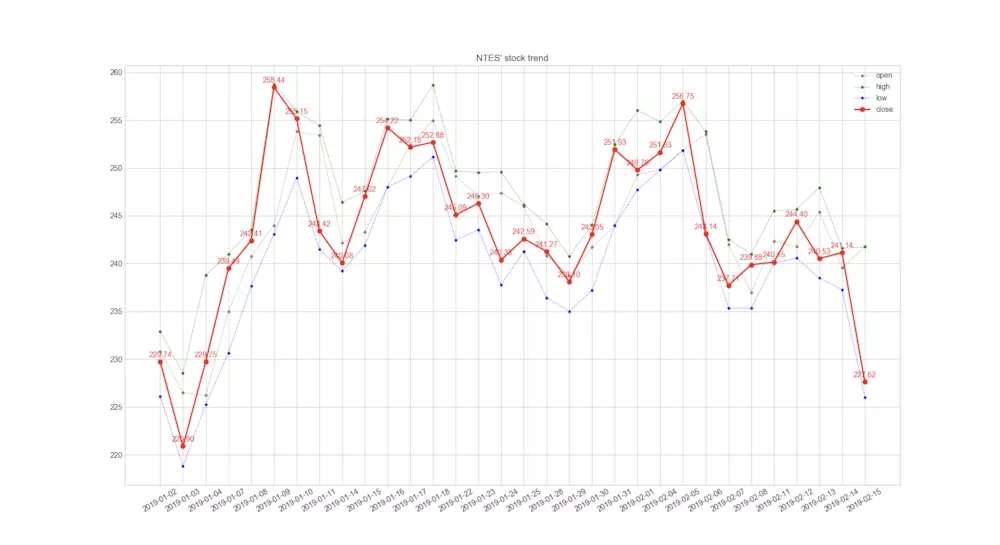
# python stock.py -c NTES -s 2019-01-01 -e 2019-02-19 -f netease_stock_trend.png运行命令如下
python stock.py -c CSCO -s 2019-01-01 -e 2019-02-19 -f cisco_stock_trend.png
图表如下
cisco
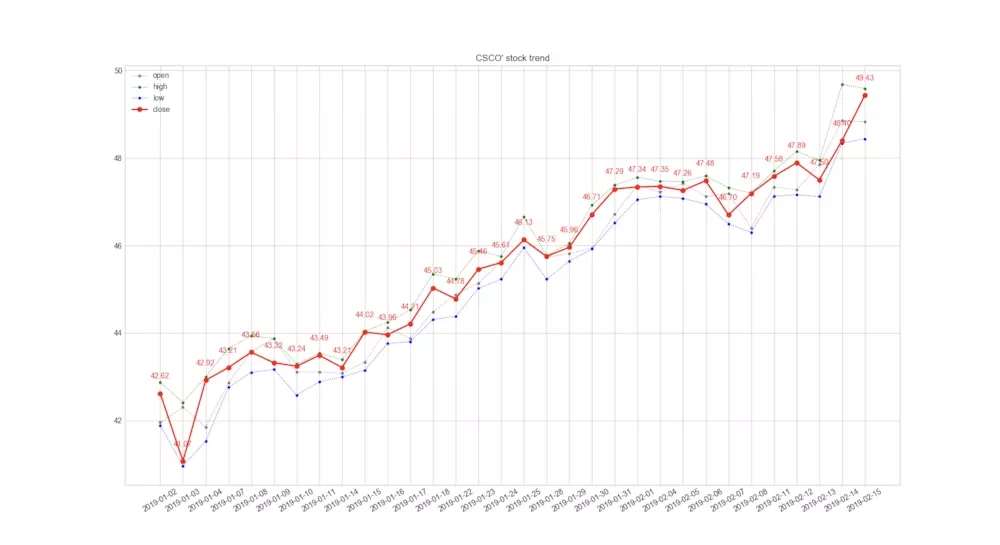
cisco
看来最近股价涨势不错。
再看看其他公司
Baidu
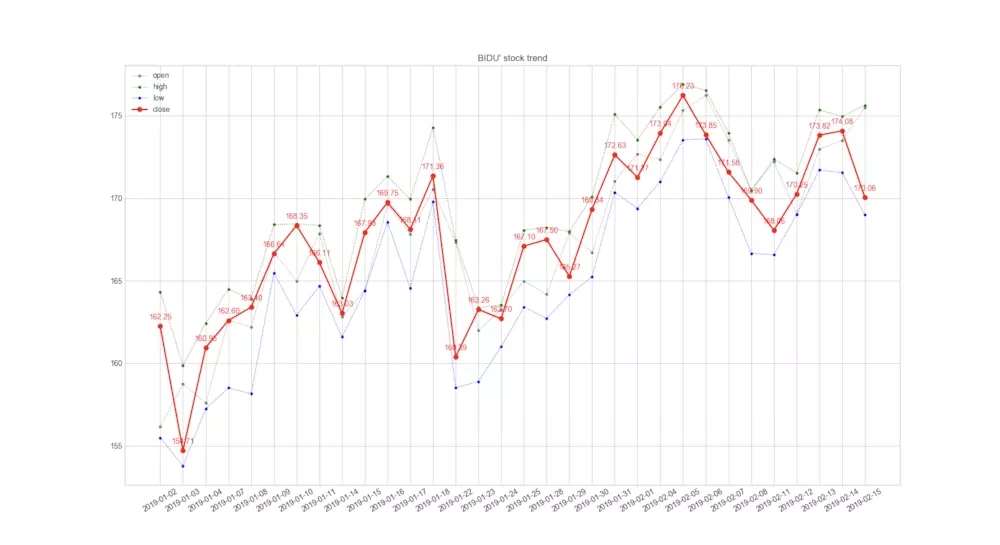
baidu
Netease
看完上述内容,你们掌握怎么在python中使用pandas绘制趋势图的方法了吗?如果还想学到更多技能或想了解更多相关内容,欢迎关注亿速云行业资讯频道,感谢各位的阅读!
免责声明:本站发布的内容(图片、视频和文字)以原创、转载和分享为主,文章观点不代表本网站立场,如果涉及侵权请联系站长邮箱:is@yisu.com进行举报,并提供相关证据,一经查实,将立刻删除涉嫌侵权内容。


