小编给大家分享一下如何解决echarts中多个折现数据出现坐标和值对不上的问题,希望大家阅读完这篇文章之后都有所收获,下面让我们一起去探讨吧!
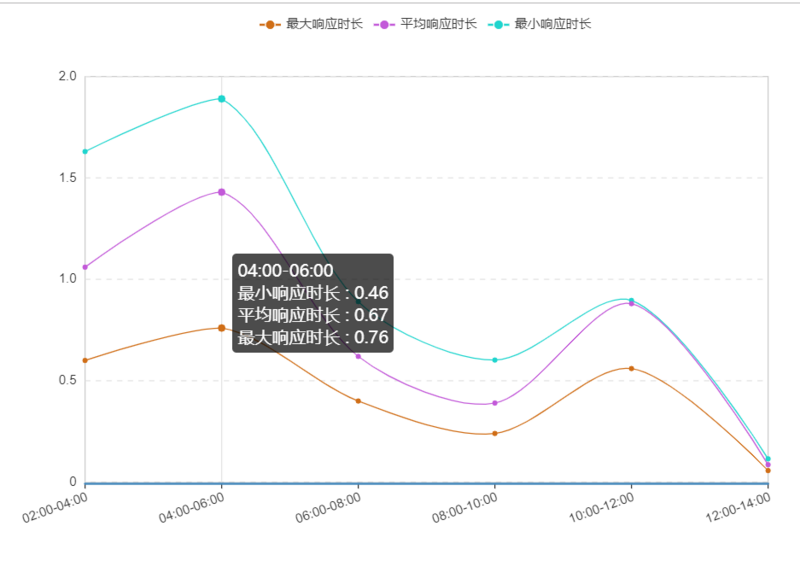
当出现多个折现数据,echarts可以配置stack值使用堆积值还是单个值
option = {
noDataLoadingOption: {
text: '暂无数据',
effect: 'bubble',
effectOption: {effect: {n: 0}}, textStyle: {fontSize: 24}
},
symbolList: ['circle'],
tooltip: {
trigger: 'axis', textStyle: {align: 'left'},
axisPointer: {lineStyle: {color: '#E3E3E3', width: 1, type: 'solid'},}
},
// grid: {x: '60px', x2: '60px', borderWidth: 0},
legend: {data: ['最大响应时长', '平均响应时长', '最小响应时长']},
toolbox: {show: true},
// calculable: true,
xAxis: [{
type: 'category',
boundaryGap: false,
data: ['00:00-02:00', '02:00-04:00', '04:00-06:00', '06:00-08:00', '08:00-10:00', '10:00-12:00'],
splitLine: {lineStyle: {width: 0}},
axisLabel: {interval: 0,/*横轴信息全部显示*/ rotate: 20,/*20度角倾斜显示*/}
}],
yAxis: [{
type: 'value',
axisLine: {lineStyle: {color: '#333', width: 0, type: 'solid'}},
splitLine: {lineStyle: {color: '#e3e3e3', width: 1, type: 'dashed'}},
}],
series: [
{
name: '最大响应时长',
smooth: true,
type: 'line',
stack: '总量', // 重要的点 这个参数会使用堆积值作为纵坐标的刻量值。
data:[........],
itemStyle: {normal: {color: '#D06E17', lineStyle: {width: 1, color: '#D06E17'}}}
},{
name: '平均响应时长',
smooth: true,
type: 'line',
stack: '总量', // 重要的点 这个参数会使用堆积值作为纵坐标的刻量值。
data:[........],
itemStyle: {normal: {color: '#C35AD9', lineStyle: {width: 1, color: '#C35AD9'}}}
},{
name: '最小响应时长',
smooth: true,
type: 'line',
stack: '总量', // 重要的点 这个参数会使用堆积值作为纵坐标的刻量值。
data:[........],
itemStyle: {normal: {color: '#1FD5CE', lineStyle: {width: 1, color: '#1FD5CE'}}}
},
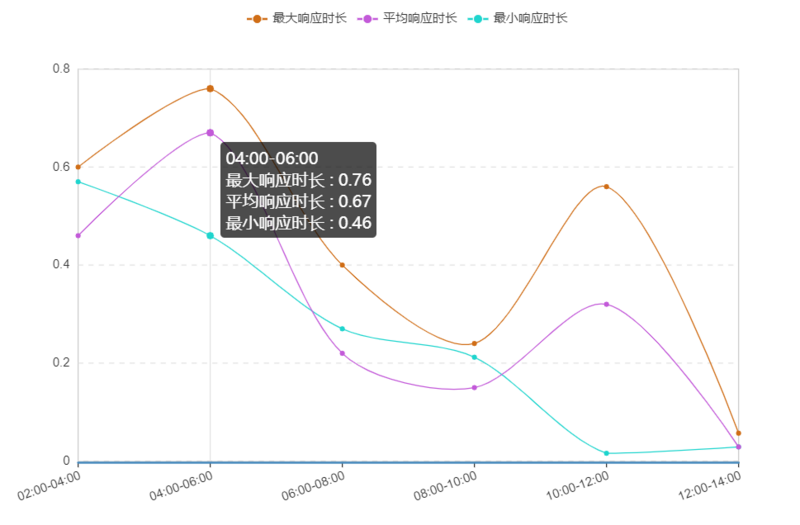
]去掉stack值后
 option3 = {
    noDataLoadingOption: {
     text: '暂无数据',
     effect: 'bubble',
     effectOption: {effect: {n: 0}}, textStyle: {fontSize: 24}
    },
    symbolList: ['circle'],
    tooltip: {
     trigger: 'axis', textStyle: {align: 'left'},
     axisPointer: {lineStyle: {color: '#E3E3E3', width: 1, type: 'solid'},}
    },
    // grid: {x: '60px', x2: '60px', borderWidth: 0},
    legend: {data: ['最大响应时长', '平均响应时长', '最小响应时长']},
    toolbox: {show: true},
    // calculable: true,
    xAxis: [{
      type: 'category',
      boundaryGap: false,
      data: ['00:00-02:00', '02:00-04:00', '04:00-06:00', '06:00-08:00', '08:00-10:00', '10:00-12:00'],
      splitLine: {lineStyle: {width: 0}},
      axisLabel: {interval: 0,/*横轴信息全部显示*/  rotate: 20,/*20度角倾斜显示*/}
     }],
    yAxis: [{
      type: 'value',
      axisLine: {lineStyle: {color: '#333', width: 0, type: 'solid'}},
      splitLine: {lineStyle: {color: '#e3e3e3', width: 1, type: 'dashed'}},
     }],
    series: [
     {
      name: '最大响应时长',
      smooth: true,
      type: 'line',
      // stack: '总量', // 去除stack这个参数
      itemStyle: {normal: {color: '#D06E17', lineStyle: {width: 1, color: '#D06E17'}}}
     },{
      name: '平均响应时长',
      smooth: true,
      type: 'line',
      // stack: '总量', // 去除stack这个参数
      itemStyle: {normal: {color: '#C35AD9', lineStyle: {width: 1, color: '#C35AD9'}}}
     },{
      name: '最小响应时长',
      smooth: true,
      type: 'line',
      // stack: '总量', // 去除stack这个参数
      itemStyle: {normal: {color: '#1FD5CE', lineStyle: {width: 1, color: '#1FD5CE'}}}
     },
   ]
 };
看完了这篇文章,相信你对“如何解决echarts中多个折现数据出现坐标和值对不上的问题”有了一定的了解,如果想了解更多相关知识,欢迎关注亿速云行业资讯频道,感谢各位的阅读!
免责声明:本站发布的内容(图片、视频和文字)以原创、转载和分享为主,文章观点不代表本网站立场,如果涉及侵权请联系站长邮箱:is@yisu.com进行举报,并提供相关证据,一经查实,将立刻删除涉嫌侵权内容。


