这篇文章主要介绍了Python+matplotlib如何实现计算两个信号的交叉谱密度,具有一定借鉴价值,感兴趣的朋友可以参考下,希望大家阅读完这篇文章之后大有收获,下面让小编带着大家一起了解一下。
计算两个信号的交叉谱密度
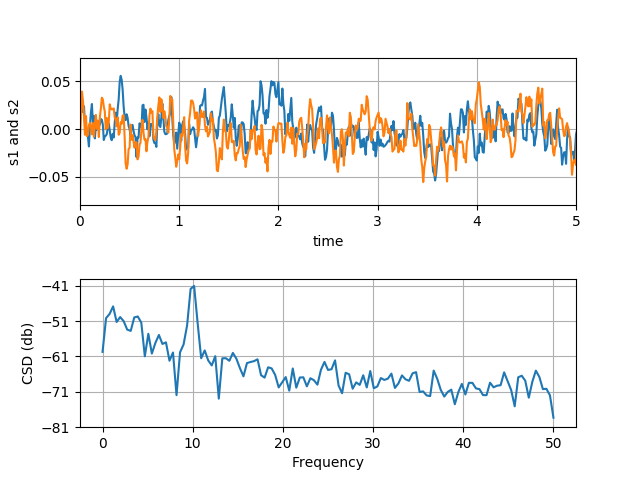
结果展示:
完整代码:
import numpy as np
import matplotlib.pyplot as plt


fig, (ax1, ax2) = plt.subplots(2, 1)
# make a little extra space between the subplots
fig.subplots_adjust(hspace=0.5)

dt = 0.01
t = np.arange(0, 30, dt)

# Fixing random state for reproducibility
np.random.seed(19680801)


nse1 = np.random.randn(len(t))         # white noise 1
nse2 = np.random.randn(len(t))         # white noise 2
r = np.exp(-t / 0.05)

cnse1 = np.convolve(nse1, r, mode='same') * dt  # colored noise 1
cnse2 = np.convolve(nse2, r, mode='same') * dt  # colored noise 2

# two signals with a coherent part and a random part
s1 = 0.01 * np.sin(2 * np.pi * 10 * t) + cnse1
s2 = 0.01 * np.sin(2 * np.pi * 10 * t) + cnse2

ax1.plot(t, s1, t, s2)
ax1.set_xlim(0, 5)
ax1.set_xlabel('time')
ax1.set_ylabel('s1 and s2')
ax1.grid(True)

cxy, f = ax2.csd(s1, s2, 256, 1. / dt)
ax2.set_ylabel('CSD (db)')
plt.show()
感谢你能够认真阅读完这篇文章,希望小编分享的“Python+matplotlib如何实现计算两个信号的交叉谱密度”这篇文章对大家有帮助,同时也希望大家多多支持亿速云,关注亿速云行业资讯频道,更多相关知识等着你来学习!
免责声明:本站发布的内容(图片、视频和文字)以原创、转载和分享为主,文章观点不代表本网站立场,如果涉及侵权请联系站长邮箱:is@yisu.com进行举报,并提供相关证据,一经查实,将立刻删除涉嫌侵权内容。


