本篇内容介绍了“oracle数据库CPU过高问题定位分析”的有关知识,在实际案例的操作过程中,不少人都会遇到这样的困境,接下来就让小编带领大家学习一下如何处理这些情况吧!希望大家仔细阅读,能够学有所成!
一、ASH
颗粒度最细最常用的诊断工具,通常当问题刚发生时,即可立即根据生成的ash报告诊断问题
下文示例为当问题出现后,查看最近5分钟的性能报告,运行ashrpt脚本后,其他选项直接默认跳过,在Enter value for begin_time选项中填写"-5"
SQL> @ashrpt
Current Instance
~~~~~~~~~~~~~~~~
   DB Id    DB Name Inst Num Instance
----------- ------------ -------- ------------
 1506959389 ORCL1 orcl
Specify the Report Type
~~~~~~~~~~~~~~~~~~~~~~~
Enter 'html' for an HTML report, or 'text' for plain text
Defaults to 'html'
Enter value for report_type:
Type Specified:  html
Instances in this Workload Repository schema
~~~~~~~~~~~~~~~~~~~~~~~~~~~~~~~~~~~~~~~~~~~~
   DB Id     Inst Num DB Name   InstanceHost
------------ -------- ------------ ------------ ------------
* 1506959389    1 ORCL   orcl localhost.lo
caldomain
Defaults to current database
Using database id: 1506959389
Enter instance numbers. Enter 'ALL' for all instances in a
RAC cluster or explicitly specify list of instances (e.g., 1,2,3).
Defaults to current instance.
Using instance number(s): 1
ASH Samples in this Workload Repository schema
~~~~~~~~~~~~~~~~~~~~~~~~~~~~~~~~~~~~~~~~~~~~~~
Oldest ASH sample available:  19-Jun-18 19:41:38   [  52092 mins in the past]
Latest ASH sample available:  25-Jul-18 23:52:52   [  1 mins in the past]
Specify the timeframe to generate the ASH report
~~~~~~~~~~~~~~~~~~~~~~~~~~~~~~~~~~~~~~~~~~~~~~~~
Enter begin time for report:
--    Valid input formats:
--To specify absolute begin time:
--  [MM/DD[/YY]] HH24:MI[:SS]
--  Examples: 02/23/03 14:30:15
--    02/23 14:30:15
--    14:30:15
--    14:30
--To specify relative begin time: (start with '-' sign)
--  -[HH24:]MI
--  Examples: -1:15  (SYSDATE - 1 Hr 15 Mins)
--    -25    (SYSDATE - 25 Mins)
Defaults to -15 mins
Enter value for begin_time: -5
Report begin time specified: -5
Enter duration in minutes starting from begin time:
Defaults to SYSDATE - begin_time
Press Enter to analyze till current time
Enter value for duration:
Report duration specified:
Using 25-Jul-18 23:48:39 as report begin time
Using 25-Jul-18 23:53:41 as report end time
Specify Slot Width (using ashrpti.sql) for 'Activity Over Time' section
~~~~~~~~~~~~~~~~~~~~~~~~~~~~~~~~~~~~~~~~~~~~~~~~~~~~~~~~~~~~~~~~~~~~~~~
-- Explanation:
--   In the 'Activity Over Time' section of the ASH report,
--   the analysis period is divided into smaller slots
--   and top wait events are reported in each of those slots.
-- Default:
--   The analysis period will be automatically split upto 10 slots
--   complying to a minimum slot width of
--     1 minute,  if the source is V$ACTIVE_SESSION_HISTORY or
--     5 minutes, if the source is DBA_HIST_ACTIVE_SESS_HISTORY.
Specify Slot Width in seconds to use in the 'Activity Over Time' section:
Defaults to a value as explained above:
Slot Width specified:
Specify Report Targets (using ashrpti.sql) to generate the ASH report
~~~~~~~~~~~~~~~~~~~~~~~~~~~~~~~~~~~~~~~~~~~~~~~~~~~~~~~~~~~~~~~~~~~~~
-- Explanation:
--   ASH Report can accept "Report Targets",
--   like a particular SQL statement, or a particular SESSION,
--   to generate the report on. If one or more report targets are
--   specified, then the data used to generate the report will only be
--   the ASH samples that pertain to ALL the specified report targets.
-- Default:
--   If none of the report targets are specified,
--   then the target defaults to all activity in the database instance.
Specify SESSION_ID (eg: from V$SESSION.SID) report target:
Defaults to NULL:
SESSION report target specified:
Specify SQL_ID (eg: from V$SQL.SQL_ID) report target:
Defaults to NULL: (% and _ wildcards allowed)
SQL report target specified:
Specify WAIT_CLASS name (eg: from V$EVENT_NAME.WAIT_CLASS) report target:
[Enter 'CPU' to investigate CPU usage]
Defaults to NULL: (% and _ wildcards allowed)
WAIT_CLASS report target specified:
Specify SERVICE_HASH (eg: from V$ACTIVE_SERVICES.NAME_HASH) report target:
Defaults to NULL:
SERVICE report target specified:
Specify MODULE name (eg: from V$SESSION.MODULE) report target:
Defaults to NULL: (% and _ wildcards allowed)
MODULE report target specified:
Specify ACTION name (eg: from V$SESSION.ACTION) report target:
Defaults to NULL: (% and _ wildcards allowed)
ACTION report target specified:
Specify CLIENT_ID (eg: from V$SESSION.CLIENT_IDENTIFIER) report target:
Defaults to NULL: (% and _ wildcards allowed)
CLIENT_ID report target specified:
Specify PLSQL_ENTRY name (eg: "SYS.DBMS_LOB.*") report target:
Defaults to NULL: (% and _ wildcards allowed)
PLSQL_ENTRY report target specified:
Specify the Report Name
~~~~~~~~~~~~~~~~~~~~~~~
The default report file name is ashrpt_1_0725_2353.html.  To use this name,
press <return> to continue, otherwise enter an alternative.
Enter value for report_name: /home/oracle/ash_test.html
Using the report name /home/oracle/ash_test.html
Summary of All User Input
-------------------------
Format       : HTML
DB Id       : 1506959389
Inst num       : 1
Begin time     : 25-Jul-18 23:48:39
End time       : 25-Jul-18 23:53:41
Slot width     : Default
Report targets : 0
Report name    : /home/oracle/ash_test.html
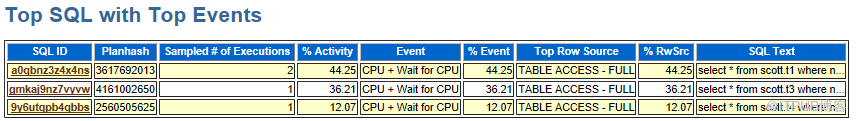
通过结果图可以观察到短时间内引发问题的sql:
二、AWR报告
由oracle的两份快照而产生的差异报告,通常一小时一次,问题情况下可通过手动生成,缩小分析问题时段的范围
一般可在问题出现时以及几分钟后,各运行exec dbms_workload_repository.create_snapshot一次
SQL> exec dbms_workload_repository.create_snapshot;
PL/SQL procedure successfully completed.
SQL> exec dbms_workload_repository.create_snapshot;
PL/SQL procedure successfully completed.
SQL> @awrrpt

Current Instance
~~~~~~~~~~~~~~~~

   DB Id    DB Name     Inst Num Instance
----------- ------------ -------- ------------
 1506959389 ORCL      1 orcl


Specify the Report Type
~~~~~~~~~~~~~~~~~~~~~~~
Would you like an HTML report, or a plain text report?
Enter 'html' for an HTML report, or 'text' for plain text
Defaults to 'html'
Enter value for report_type:

Type Specified:  html


Instances in this Workload Repository schema
~~~~~~~~~~~~~~~~~~~~~~~~~~~~~~~~~~~~~~~~~~~~

   DB Id     Inst Num DB Name      Instance  Host
------------ -------- ------------ ------------ ------------
* 1506959389       1 ORCL    orcl     localhost.lo
                        caldomain

Using 1506959389 for database Id
Using          1 for instance number


Specify the number of days of snapshots to choose from
~~~~~~~~~~~~~~~~~~~~~~~~~~~~~~~~~~~~~~~~~~~~~~~~~~~~~~
Entering the number of days (n) will result in the most recent
(n) days of snapshots being listed.  Pressing <return> without
specifying a number lists all completed snapshots.


Enter value for num_days:

Listing all Completed Snapshots

                            Snap
Instance     DB Name      Snap Id    Snap Started    Level
------------ ------------ --------- ------------------ -----
orcl         ORCL       21 25 Jul 2018 22:30     1
                 22 25 Jul 2018 23:42     1
                 23 25 Jul 2018 23:45     1
                 24 25 Jul 2018 23:47     1
                 25 25 Jul 2018 23:49     1
                 26 25 Jul 2018 23:51     1
                 27 26 Jul 2018 00:04     1
                 28 26 Jul 2018 00:07     1
                 29 26 Jul 2018 00:08     1
                 30 26 Jul 2018 00:09     1


Specify the Begin and End Snapshot Ids
~~~~~~~~~~~~~~~~~~~~~~~~~~~~~~~~~~~~~~
Enter value for begin_snap: 29
Begin Snapshot Id specified: 29

Enter value for end_snap: 30
End   Snapshot Id specified: 30


Specify the Report Name
~~~~~~~~~~~~~~~~~~~~~~~
The default report file name is awrrpt_1_29_30.html.  To use this name,
press <return> to continue, otherwise enter an alternative.

Enter value for report_name: /home/oracle/awr_test1.html

Using the report name /home/oracle/awr_test1.html
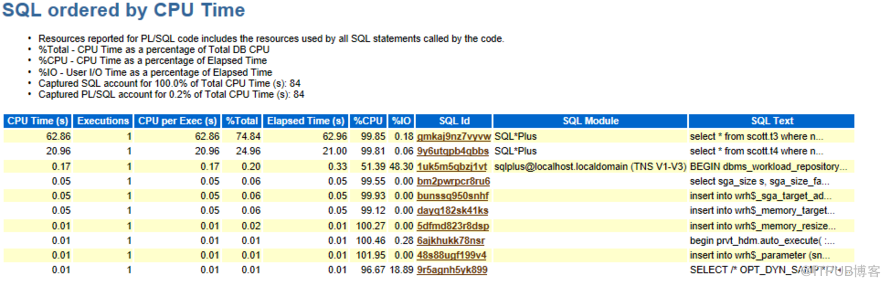
根据查看SQL ordered by CPU Time,可观察出相应时间段的高CPU消耗SQL
三、ADDM
与awr类似,依托于快照生成,但有详细的分析建议(可在方法二中手动生成两次快照后使用)
运行exec DBMS_ADDM.ANALYZE_DB()命令时,第2、3参数分别为两次手动生成的快照号
SQL>  var task_name varchar2(30);
SQL> exec DBMS_ADDM.ANALYZE_DB(:task_name,21,36);
PL/SQL procedure successfully completed.
SQL> print :task_name
TASK_NAME
--------------------------------------------------------------------------------
TASK_236
SQL> set long 1000000 pagesize 0;
SQL> select dbms_addm.get_report('TASK_236') from dual;


通过报告可以精确的看到性能主要被消耗于哪里,消耗大小,以及事件描述

ADDM Report for Task 'TASK_236'
-------------------------------
Analysis Period
---------------
AWR snapshot range from 21 to 36.
Time period starts at 25-JUL-18 10.30.54 PM
Time period ends at 26-JUL-18 10.00.29 PM
Analysis Target
---------------
Database 'ORCL' with DB ID 1506959389.
Database version 11.2.0.4.0.
Analysis was requested for all instances, but ADDM analyzed instance orcl,
numbered 1 and hosted at localhost.localdomain.
See the "Additional Information" section for more information on the requested instances.
Activity During the Analysis Period
-----------------------------------
Total database time was 1445 seconds.
The average number of active sessions was .02.
ADDM analyzed 1 of the requested 1 instances.
Summary of Findings
-------------------
   Description     Active Sessions  Recommendations     Percent of Activity
   ----------------------------------------  -------------------  --------------
-
1  Top SQL Statements     .02 | 88.73  4
2  PL/SQL Execution     .01 | 41.55  1
3  Unusual "User I/O" Wait Event     0 | 28.78  4
4  Top Segments by "User I/O" and "Cluster"  0 | 28.64  1
5  Undersized instance memory     0 | 23.6  1
6  Sequence Usage     0 | 2.14  1
~~~~~~~~~~~~~~~~~~~~~~~~~~~~~~~~~~~~~~~~~~~~~~~~~~~~~~~~~~~~~~~~~~~~~~~~~~~~~~~~~~~~~~~~~~~~~~~~~~~~~~~~~~~~~~~~~~~~~~~~~~~~~~~~~~~~~~~~~~~~~~~~~~~~~~~~~~~~
Findings and Recommendations
----------------------------
Finding 1: Top SQL Statements
Impact is .02 active sessions, 88.73% of total activity.
--------------------------------------------------------
SQL statements consuming significant database time were found. These
statements offer a good opportunity for performance improvement.
   Recommendation 1: SQL Tuning
   Estimated benefit is .01 active sessions, 36.62% of total activity.
   -------------------------------------------------------------------
   Action
      Run SQL Tuning Advisor on the INSERT statement with SQL_ID      "5hrxg25g8bdpd".
      Related Object SQL statement with SQL_ID 5hrxg25g8bdpd.
 INSERT INTO T1 VALUES (S_T1_ID.NEXTVAL,DBMS_RANDOM.STRING('u', 10),SYSDATE)
   Rationale
      The SQL spent 100% of its database time on CPU, I/O and Cluster waits.
      This part of database time may be improved by the SQL Tuning Advisor.
   Rationale
      Database time for this SQL was divided as follows: 45% for SQL execution, 0% for parsing, 55% for PL/SQL execution and 0% for Java execution.
   Rationale
      SQL statement with SQL_ID "5hrxg25g8bdpd" was executed 8000000 times and
      had an average elapsed time of 0.00004 seconds.
   Rationale
      Top level calls to execute the PL/SQL statement with SQL_ID
      "7j89gjdpf4m4u" are responsible for 100% of the database time spent on
      the INSERT statement with SQL_ID "5hrxg25g8bdpd".
      Related Object
 SQL statement with SQL_ID 7j89gjdpf4m4u.
 begin
 for i in 1 .. 1000000 loop
 insert into t1 values (s_t1_id.Nextval,dbms_random.string('u',
 10),sysdate);
 end loop;
 end;
   Recommendation 2: SQL Tuning
   Estimated benefit is 0 active sessions, 28.87% of total activity.
   -----------------------------------------------------------------
   Action
      Investigate the ALTER TABLESPACE statement with SQL_ID "6sqc239sgbmqf"
      for possible performance improvements. You can supplement the
      information given here with an ASH report for this SQL_ID.
      Related Object
 SQL statement with SQL_ID 6sqc239sgbmqf.
   Rationale
      The SQL Tuning Advisor cannot operate on ALTER TABLESPACE statements.
   Rationale
      Database time for this SQL was divided as follows: 100% for SQL
      execution, 0% for parsing, 0% for PL/SQL execution and 0% for Java
      execution.
   Rationale
      I/O and Cluster wait for TABLE "SYS.KOTTD$" with object ID 543 consumed
      97% of the database time spent on this SQL statement.
   Recommendation 3: SQL Tuning
   Estimated benefit is 0 active sessions, 14.08% of total activity.
   -----------------------------------------------------------------
   Action
      Run SQL Tuning Advisor on the SELECT statement with SQL_ID
      "a0qbnz3z4x4ns".
      Related Object
 SQL statement with SQL_ID a0qbnz3z4x4ns.
 select * from scott.t1 where name=dbms_random.string('u', 10)
   Rationale
      The SQL spent 100% of its database time on CPU, I/O and Cluster waits.
      This part of database time may be improved by the SQL Tuning Advisor.
   Rationale
      Database time for this SQL was divided as follows: 5% for SQL execution,
      0% for parsing, 95% for PL/SQL execution and 0% for Java execution.
   Rationale
      SQL statement with SQL_ID "a0qbnz3z4x4ns" was executed 2 times and had
      an average elapsed time of 89 seconds.
   Recommendation 4: SQL Tuning
   Estimated benefit is 0 active sessions, 9.15% of total activity.
   ----------------------------------------------------------------
   Action
      Run SQL Tuning Advisor on the SELECT statement with SQL_ID
      "gmkaj9nz7vyvw".
      Related Object
 SQL statement with SQL_ID gmkaj9nz7vyvw.
 select * from scott.t3 where name=dbms_random.string('u', 10)
   Rationale
      The SQL spent 100% of its database time on CPU, I/O and Cluster waits.
      This part of database time may be improved by the SQL Tuning Advisor.
   Rationale
      Database time for this SQL was divided as follows: 16% for SQL
      execution, 0% for parsing, 84% for PL/SQL execution and 0% for Java
      execution.
   Rationale
      SQL statement with SQL_ID "gmkaj9nz7vyvw" was executed 2 times and had
      an average elapsed time of 62 seconds.
Finding 2: PL/SQL Execution
Impact is .01 active sessions, 41.55% of total activity.
--------------------------------------------------------
PL/SQL execution consumed significant database time.
   Recommendation 1: SQL Tuning
   Estimated benefit is .01 active sessions, 41.55% of total activity.
   -------------------------------------------------------------------
   Action
      Tune the entry point PL/SQL "SYS.DBMS_RANDOM.STRING" of type "PACKAGE"
      and ID 9372. Refer to the PL/SQL documentation for addition information.
   Rationale
      193 seconds spent in executing PL/SQL
      "SYS.DBMS_RANDOM.RECORD_RANDOM_NUMBER" of type "PACKAGE" and ID 9372.
   Rationale
      193 seconds spent in executing PL/SQL
      "SYS.DBMS_RANDOM.REPLAY_RANDOM_NUMBER" of type "PACKAGE" and ID 9372.
   Rationale
      111 seconds spent in executing PL/SQL "SYS.DBMS_RANDOM.STRING" of type
      "PACKAGE" and ID 9372.
   Rationale
      101 seconds spent in executing PL/SQL "SYS.DBMS_RANDOM.VALUE#1" of type
      "PACKAGE" and ID 9372.
Finding 3: Unusual "User I/O" Wait Event
Impact is 0 active sessions, 28.78% of total activity.
------------------------------------------------------
Wait event "Data file init write" in wait class "User I/O" was consuming
significant database time.
   Recommendation 1: Application Analysis
   Estimated benefit is 0 active sessions, 28.78% of total activity.
   -----------------------------------------------------------------
   Action
      Investigate the cause for high "Data file init write" waits. Refer to
      Oracle's "Database Reference" for the description of this wait event.
   Recommendation 2: Application Analysis
   Estimated benefit is 0 active sessions, 28.78% of total activity.
   -----------------------------------------------------------------
   Action
      Investigate the cause for high "Data file init write" waits in Module
      "sqlplus@localhost.localdomain (TNS V1-V3)".
   Recommendation 3: Application Analysis
   Estimated benefit is 0 active sessions, 28.78% of total activity.
   -----------------------------------------------------------------
   Action
      Investigate the cause for high "Data file init write" waits in Service
      "SYS$USERS".
   Recommendation 4: Application Analysis
   Estimated benefit is 0 active sessions, 28.78% of total activity.
   -----------------------------------------------------------------
   Action
      Investigate the cause for high "Data file init write" waits with
      P1,P2,P3 ("count, intr, timeout") values "1", "256" and "4294967295"
      respectively.
   Symptoms That Led to the Finding:
   ---------------------------------
      Wait class "User I/O" was consuming significant database time.
      Impact is .01 active sessions, 32.41% of total activity.
Finding 4: Top Segments by "User I/O" and "Cluster"
Impact is 0 active sessions, 28.64% of total activity.
------------------------------------------------------
Individual database segments responsible for significant "User I/O" and
"Cluster" waits were found.
   Recommendation 1: Segment Tuning
   Estimated benefit is 0 active sessions, 28.64% of total activity.
   -----------------------------------------------------------------
   Action
      Investigate application logic involving I/O on TABLE "SYS.KOTTD$" with
      object ID 543.
      Related Object
 Database object with ID 543.
   Action
      Look at the "Top SQL Statements" finding for SQL statements consuming
      significant I/O on this segment. For example, the ALTER TABLESPACE
      statement with SQL_ID "6sqc239sgbmqf" is responsible for 98% of "User
      I/O" and "Cluster" waits for this segment.
   Rationale
      The I/O usage statistics for the object are: 0 full object scans, 2
      physical reads, 0 physical writes and 0 direct reads.
   Symptoms That Led to the Finding:
   ---------------------------------
      Wait class "User I/O" was consuming significant database time.
      Impact is .01 active sessions, 32.41% of total activity.
Finding 5: Undersized instance memory
Impact is 0 active sessions, 23.6% of total activity.
-----------------------------------------------------
The Oracle instance memory (SGA and PGA) was inadequately sized, causing
additional I/O and CPU usage.
The value of parameter "memory_target" was "300 M" during the analysis period.
   Recommendation 1: Database Configuration
   Estimated benefit is 0 active sessions, 14.46% of total activity.
   -----------------------------------------------------------------
   Action
      Increase memory allocated to the instance by setting the parameter
      "memory_target" to 450 M.
   Symptoms That Led to the Finding:
   ---------------------------------
      Wait class "User I/O" was consuming significant database time.
      Impact is .01 active sessions, 32.41% of total activity.
      Hard parsing of SQL statements was consuming significant database time.
      Impact is 0 active sessions, 2.07% of total activity.
Finding 6: Sequence Usage
Impact is 0 active sessions, 2.14% of total activity.
-----------------------------------------------------
Sequence cache misses were consuming significant database time.
   Recommendation 1: Application Analysis
   Estimated benefit is 0 active sessions, 2.14% of total activity.
   ----------------------------------------------------------------
   Action
      Investigate application or look at top SQL to find hot sequences. Use a
      larger cache size for those sequences. Try avoiding the use of the ORDER
      setting if running RAC.
~~~~~~~~~~~~~~~~~~~~~~~~~~~~~~~~~~~~~~~~~~~~~~~~~~~~~~~~~~~~~~~~~~~~~~~~~~~~~~
~~~~~~~~~~~~~~~~~~~~~~~~~~~~~~~~~~~~~~~~~~~~~~~~~~~~~~~~~~~~~~~~~~~~~~~~~~~~~~
  Additional Information
  ----------------------
Miscellaneous Information
-------------------------
Wait class "Application" was not consuming significant database time.
Wait class "Commit" was not consuming significant database time.
Wait class "Concurrency" was not consuming significant database time.
Wait class "Configuration" was not consuming significant database time.
CPU was not a bottleneck for the instance.
Wait class "Network" was not consuming significant database time.
Session connect and disconnect calls were not consuming significant database
time.
“oracle数据库CPU过高问题定位分析”的内容就介绍到这里了,感谢大家的阅读。如果想了解更多行业相关的知识可以关注亿速云网站,小编将为大家输出更多高质量的实用文章!
免责声明:本站发布的内容(图片、视频和文字)以原创、转载和分享为主,文章观点不代表本网站立场,如果涉及侵权请联系站长邮箱:is@yisu.com进行举报,并提供相关证据,一经查实,将立刻删除涉嫌侵权内容。


