用python实现梯度下降算法的方式是什么?这个问题可能是我们日常学习或工作经常见到的。希望通过这个问题能让你收获颇深。下面是小编给大家带来的参考内容,让我们一起来看看吧!
python版本选择
这里选的python版本是2.7,因为我之前用python3试了几次,发现在画3d图的时候会报错,所以改用了2.7。
(推荐教程:Python入门教程)
数据集选择
数据集我选了一个包含两个变量,三个参数的数据集,这样可以画出3d图形对结果进行验证。
部分函数总结
symbols()函数:首先要安装sympy库才可以使用。用法:
>>> x1 = symbols('x2')
>>> x1 + 1
x2 + 1
在这个例子中,x1和x2是不一样的,x2代表的是一个函数的变量,而x1代表的是python中的一个变量,它可以表示函数的变量,也可以表示其他的任何量,它替代x2进行函数的计算。实际使用的时候我们可以将x1,x2都命名为x,但是我们要知道他们俩的区别。
再看看这个例子:
>>> x = symbols('x')
>>> expr = x + 1
>>> x = 2
>>> print(expr)
x + 1
作为python变量的x被2这个数值覆盖了,所以它现在不再表示函数变量x,而expr依然是函数变量x+1的别名,所以结果依然是x+1。
subs()函数:既然普通的方法无法为函数变量赋值,那就肯定有函数来实现这个功能,用法:
>>> (1 + x*y).subs(x, pi)#一个参数时的用法
pi*y + 1
>>> (1 + x*y).subs({x:pi, y:2})#多个参数时的用法
1 + 2*pi
diff()函数:求偏导数,用法:result=diff(fun,x),这个就是求fun函数对x变量的偏导数,结果result也是一个变量,需要赋值才能得到准确结果。
代码实现:
from __future__ import division
from sympy import symbols, diff, expand
import numpy as np
import matplotlib.pyplot as plt
from mpl_toolkits.mplot3d import Axes3D
data = {'x1': [100, 50, 100, 100, 50, 80, 75, 65, 90, 90],
'x2': [4, 3, 4, 2, 2, 2, 3, 4, 3, 2],
'y': [9.3, 4.8, 8.9, 6.5, 4.2, 6.2, 7.4, 6.0, 7.6, 6.1]}#初始化数据集
theta0, theta1, theta2 = symbols('theta0 theta1 theta2', real=True) # y=theta0+theta1*x1+theta2*x2,定义参数
costfuc = 0 * theta0
for i in range(10):
costfuc += (theta0 + theta1 * data['x1'][i] + theta2 * data['x2'][i] - data['y'][i]) ** 2
costfuc /= 20#初始化代价函数
dtheta0 = diff(costfuc, theta0)
dtheta1 = diff(costfuc, theta1)
dtheta2 = diff(costfuc, theta2)
rtheta0 = 1
rtheta1 = 1
rtheta2 = 1#为参数赋初始值
costvalue = costfuc.subs({theta0: rtheta0, theta1: rtheta1, theta2: rtheta2})
newcostvalue = 0#用cost的值的变化程度来判断是否已经到最小值了
count = 0
alpha = 0.0001#设置学习率,一定要设置的比较小,否则无法到达最小值
while (costvalue - newcostvalue > 0.00001 or newcostvalue - costvalue > 0.00001) and count < 1000:
count += 1
costvalue = newcostvalue
rtheta0 = rtheta0 - alpha * dtheta0.subs({theta0: rtheta0, theta1: rtheta1, theta2: rtheta2})
rtheta1 = rtheta1 - alpha * dtheta1.subs({theta0: rtheta0, theta1: rtheta1, theta2: rtheta2})
rtheta2 = rtheta2 - alpha * dtheta2.subs({theta0: rtheta0, theta1: rtheta1, theta2: rtheta2})
newcostvalue = costfuc.subs({theta0: rtheta0, theta1: rtheta1, theta2: rtheta2})
rtheta0 = round(rtheta0, 4)
rtheta1 = round(rtheta1, 4)
rtheta2 = round(rtheta2, 4)#给结果保留4位小数,防止数值溢出
print(rtheta0, rtheta1, rtheta2)
fig = plt.figure()
ax = Axes3D(fig)
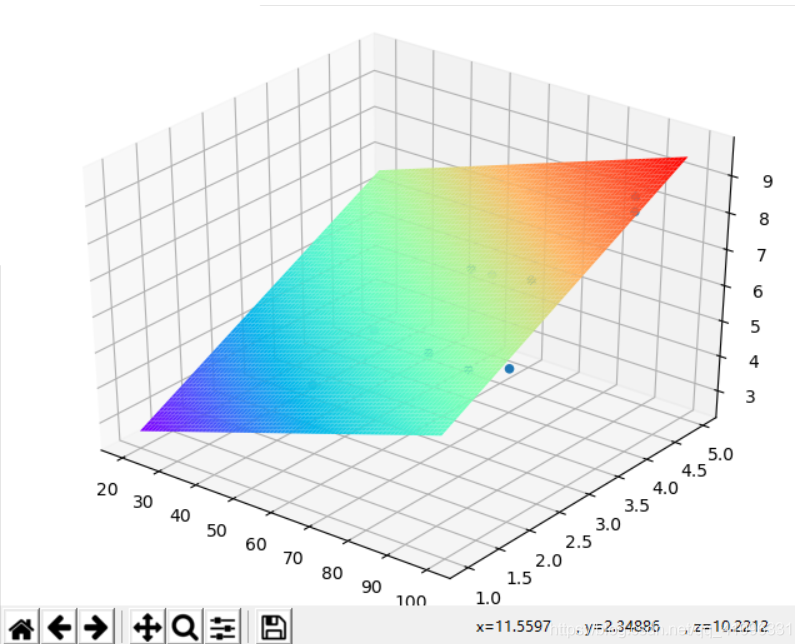
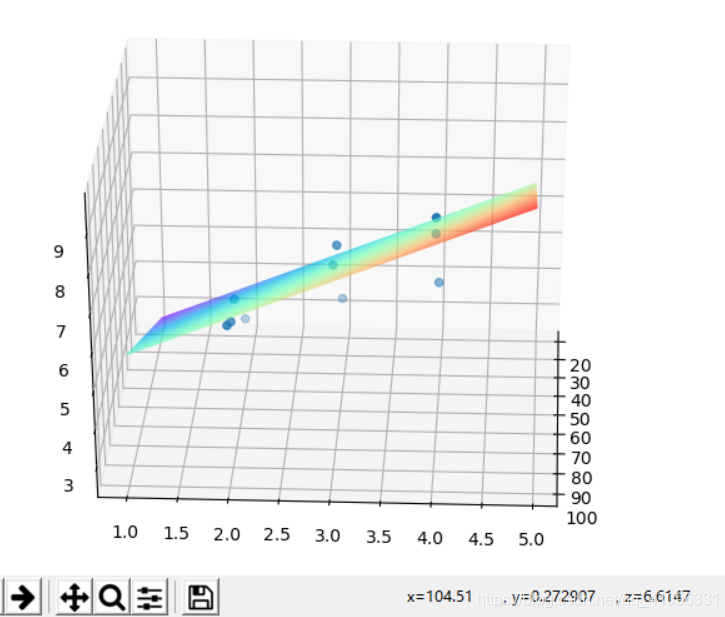
ax.scatter(data['x1'], data['x2'], data['y']) # 绘制散点图
xx = np.arange(20, 100, 1)
yy = np.arange(1, 5, 0.05)
X, Y = np.meshgrid(xx, yy)
Z = X * rtheta1 + Y * rtheta2 + rtheta0
ax.plot_surface(X, Y, Z, rstride=1, cstride=1, cmap=plt.get_cmap('rainbow'))
plt.show()#绘制3d图进行验证结果:
感谢各位的阅读!看完上述内容,你们对用python实现梯度下降算法的方式是什么大概了解了吗?希望文章内容对大家有所帮助。如果想了解更多相关文章内容,欢迎关注亿速云行业资讯频道。
免责声明:本站发布的内容(图片、视频和文字)以原创、转载和分享为主,文章观点不代表本网站立场,如果涉及侵权请联系站长邮箱:is@yisu.com进行举报,并提供相关证据,一经查实,将立刻删除涉嫌侵权内容。


