这篇文章主要介绍python爬虫之天气数据分析的示例,文中介绍的非常详细,具有一定的参考价值,感兴趣的小伙伴们一定要看完!
使用pygal绘图,使用该模块前需先安装pip install pygal,然后导入import pygal
bar = pygal.Line() # 创建折线图
bar.add('最低气温', lows) #添加两线的数据序列
bar.add('最高气温', highs) #注意lows和highs是int型的列表
bar.x_labels = daytimes
bar.x_labels_major = daytimes[::30]
bar.x_label_rotation = 45
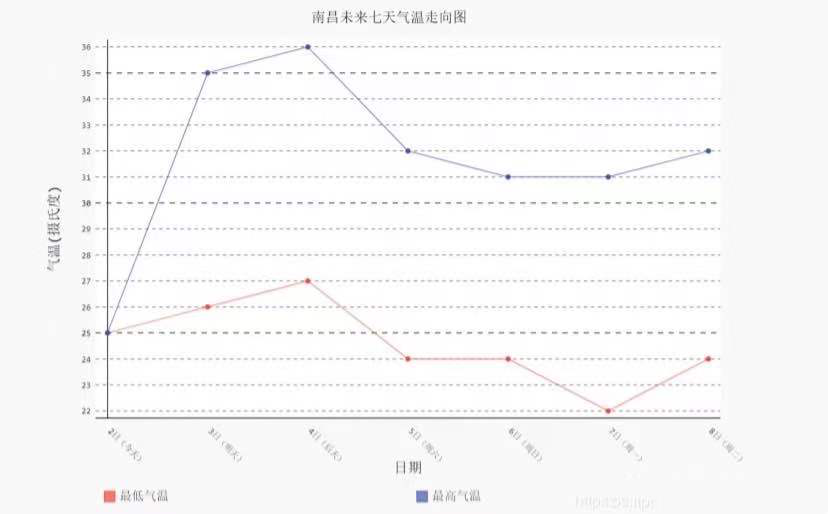
bar.title = cityname+'未来七天气温走向图' #设置图形标题
bar.x_title = '日期' #x轴标题
bar.y_title = '气温(摄氏度)' # y轴标题
bar.legend_at_bottom = True
bar.show_x_guides = False
bar.show_y_guides = True
bar.render_to_file('temperate1.svg') # 将图像保存为SVG文件,可通过浏览器查看最终生成的图形如下图所示,直观的显示了天气情况:
完整代码
import csv
import sys
import urllib.request
from bs4 import BeautifulSoup  # 解析页面模块
import pygal
import cityinfo


cityname = input("请输入你想要查询天气的城市:")
if cityname in cityinfo.city:
    citycode = cityinfo.city[cityname]
else:
    sys.exit()

url = '非常抱歉,网页无法访问' + citycode + '.shtml'
header = ("User-Agent","Mozilla/5.0 (Windows NT 10.0; Win64; x64) AppleWebKit/537.36 (KHTML, like Gecko) Chrome/76.0.3809.132 Safari/537.36")  # 设置头部信息
http_handler = urllib.request.HTTPHandler()
opener = urllib.request.build_opener(http_handler)  # 修改头部信息
opener.addheaders = [header]
request = urllib.request.Request(url)  # 制作请求
response = opener.open(request)  # 得到应答包
html = response.read()  # 读取应答包
html = html.decode('utf-8')  # 设置编码,否则会乱码

# 根据得到的页面信息进行初步筛选过滤
final = []  # 初始化一个列表保存数据
bs = BeautifulSoup(html, "html.parser")  # 创建BeautifulSoup对象
body = bs.body
data = body.find('div', {'id': '7d'})
print(type(data))
ul = data.find('ul')
li = ul.find_all('li')

# 爬取自己需要的数据
i = 0  # 控制爬取的天数
lows = []  # 保存低温
highs = []  # 保存高温
daytimes = []  # 保存日期
weathers = []  # 保存天气
for day in li:  # 便利找到的每一个li
    if i < 7:
        temp = []  # 临时存放每天的数据
        date = day.find('h2').string  # 得到日期
        #print(date)
        temp.append(date)
        daytimes.append(date)
        inf = day.find_all('p')  # 遍历li下面的p标签 有多个p需要使用find_all 而不是find

        #print(inf[0].string)  # 提取第一个p标签的值,即天气
        temp.append(inf[0].string)
        weathers.append(inf[0].string)
        temlow = inf[1].find('i').string  # 最低气温
        if inf[1].find('span') is None:  # 天气预报可能没有最高气温
            temhigh = None
            temperate = temlow
        else:
            temhigh = inf[1].find('span').string  # 最高气温
            temhigh = temhigh.replace('℃', '')
            temperate = temhigh + '/' + temlow
        # temp.append(temhigh)
        # temp.append(temlow)
        lowStr = ""
        lowStr = lowStr.join(temlow.string)
        lows.append(int(lowStr[:-1]))  # 以上三行将低温NavigableString转成int类型并存入低温列表
        if temhigh is None:
            highs.append(int(lowStr[:-1]))
        else:
            highStr = ""
            highStr = highStr.join(temhigh)
            highs.append(int(highStr))  # 以上三行将高温NavigableString转成int类型并存入高温列表
        temp.append(temperate)
        final.append(temp)
        i = i + 1

# 将最终的获取的天气写入csv文件
with open('weather.csv', 'a', errors='ignore', newline='') as f:
    f_csv = csv.writer(f)
    f_csv.writerows([cityname])
    f_csv.writerows(final)

# 绘图
bar = pygal.Line()  # 创建折线图
bar.add('最低气温', lows)
bar.add('最高气温', highs)

bar.x_labels = daytimes
bar.x_labels_major = daytimes[::30]
# bar.show_minor_x_labels = False  # 不显示X轴最小刻度
bar.x_label_rotation = 45

bar.title = cityname+'未来七天气温走向图'
bar.x_title = '日期'
bar.y_title = '气温(摄氏度)'

bar.legend_at_bottom = True

bar.show_x_guides = False
bar.show_y_guides = True

bar.render_to_file('temperate.svg')
以上是python爬虫之天气数据分析的示例的所有内容,感谢各位的阅读!希望分享的内容对大家有帮助,更多相关知识,欢迎关注亿速云行业资讯频道!
免责声明:本站发布的内容(图片、视频和文字)以原创、转载和分享为主,文章观点不代表本网站立场,如果涉及侵权请联系站长邮箱:is@yisu.com进行举报,并提供相关证据,一经查实,将立刻删除涉嫌侵权内容。


