python 3.9 Numpy scipyе’ҢmatlabplotеҰӮдҪ•еңЁwindowsзҺҜеўғдёӯе®үиЈ…
python 3.9 Numpy scipyе’ҢmatlabplotеҰӮдҪ•еңЁwindowsзҺҜеўғдёӯе®үиЈ…пјҹзӣёдҝЎеҫҲеӨҡжІЎжңүз»ҸйӘҢзҡ„дәәеҜ№жӯӨжқҹжүӢж— зӯ–пјҢдёәжӯӨжң¬ж–ҮжҖ»з»“дәҶй—®йўҳеҮәзҺ°зҡ„еҺҹеӣ е’Ңи§ЈеҶіж–№жі•пјҢйҖҡиҝҮиҝҷзҜҮж–Үз« еёҢжңӣдҪ иғҪи§ЈеҶіиҝҷдёӘй—®йўҳгҖӮ
1 йҰ–е…Ҳжү“ејҖcmd
win+r
2 pipе®үиЈ…
pip3 install --user numpy scipy matplotlib
вҖ“user йҖүйЎ№еҸҜд»Ҙи®ҫзҪ®еҸӘе®үиЈ…еңЁеҪ“еүҚзҡ„з”ЁжҲ·дёӢпјҢиҖҢдёҚжҳҜеҶҷе…ҘеҲ°зі»з»ҹзӣ®еҪ•гҖӮй»ҳи®Өжғ…еҶөдҪҝз”ЁеӣҪеӨ–зәҝи·ҜпјҢеӣҪеӨ–еӨӘж…ўпјҢжҲ‘们дҪҝз”Ёжё…еҚҺзҡ„й•ңеғҸе°ұеҸҜд»Ҙ:
pip3 install numpy scipy matplotlib -i https://pypi.tuna.tsinghua.edu.cn/simple
еҰӮдҪ•зҪ‘з»ңдёҚеҘҪпјҢжҲ‘们еҸҜд»ҘжҢЁдёӘеҚ•зӢ¬е®үиЈ…
pip3 install numpy s -i https://pypi.tuna.tsinghua.edu.cn/simple

pip3 install scipy -i https://pypi.tuna.tsinghua.edu.cn/simple

pip3 install matplotlib -i https://pypi.tuna.tsinghua.edu.cn/simple
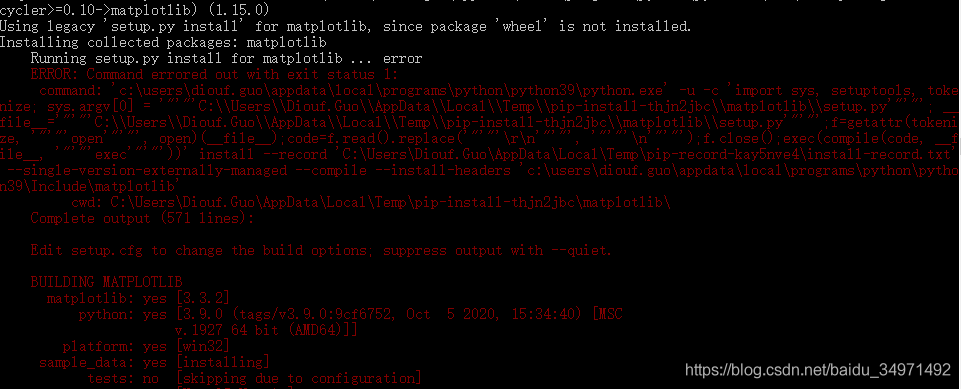
3 е®үиЈ…matlabplotж—¶йҒҮеҲ°й”ҷиҜҜпјҡ
Using legacy 'setup.py install' for matplotlib, since package 'wheel' is not installed.
Installing collected packages: matplotlib
Running setup.py install for matplotlib ... error
ERROR: Command errored out with exit status 1:
жҹҘзңӢиҮӘе·ұзҡ„pythonзүҲжң¬пјҡ
Python 3.9.0 (tags/v3.9.0:9cf6752, Oct 5 2020, 15:34:40) [MSC v.1927 64 bit (AMD64)] on win32 Type "help", "copyright", "credits" or "license()" for more information.
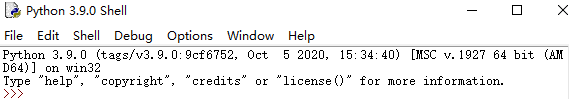
жҲ‘зҡ„pythonжҳҜ3.9 AMD64
еңЁhttps://www.lfd.uci.edu/~gohlke/pythonlibs/зҪ‘з«ҷжүҫеҲ°worldcould
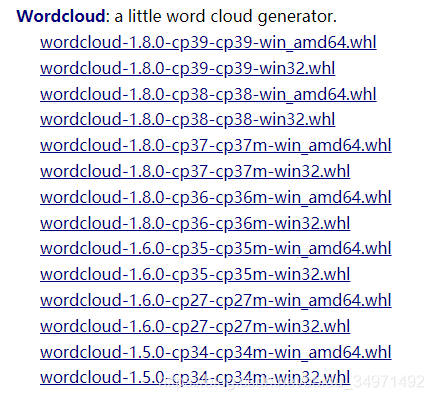
йҖүзқҖиҮӘе·ұзӣёеә”зҡ„.whlдёӢиҪҪгҖӮжҲ‘зҡ„йҖүпјҡ
wordcloud-1.8.0-cp39-cp39-win_amd64.whl
然еҗҺеӣһеҲ°cmd
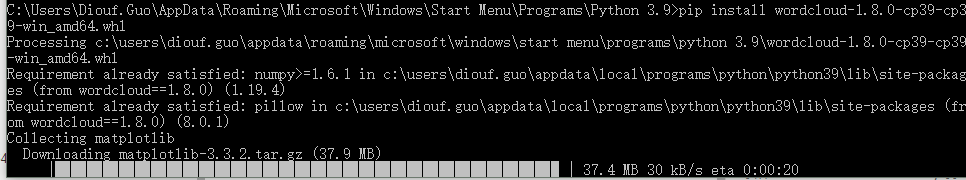
4 е®үиЈ…
pip install wordcloud-1.8.0-cp39-cp39-win_amd64.whl
5 еҶҚж¬ЎеҮәзҺ°й”ҷиҜҜ
Using legacy 'setup.py install' for matplotlib, since package 'wheel' is not installed.
зӣҙжҺҘе®үиЈ…wheel
pip install wheel
6 еҶҚж¬Ўе®үиЈ…matlabplot
pip3 install matplotlib -i https://pypi.tuna.tsinghua.edu.cn/simple
дёҚжҲҗеҠҹ
7 еңЁhttps://www.lfd.uci.edu/~gohlke/pythonlibs/жүҫеҲ°matlabplot
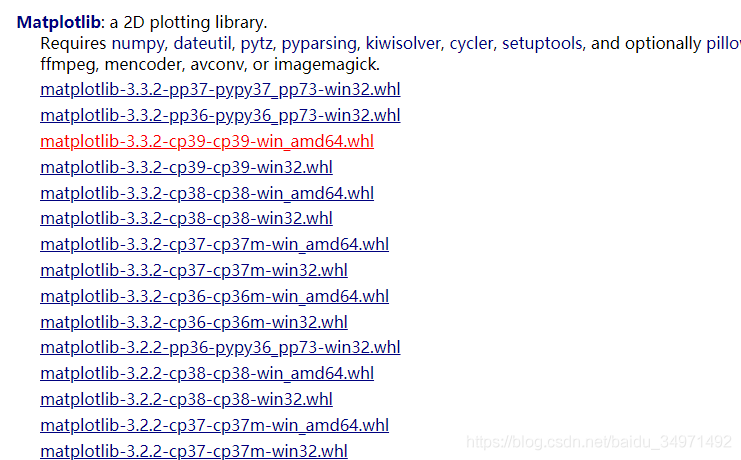
дёӢиҪҪеҗҺе®үиЈ…пјҢ
pip3 install matplotlib-3.3.2-cp39-cp39-win_amd64.whl

жҳҫзӨәе®үиЈ…жҲҗеҠҹпјҢиө¶зҙ§жүҫдёӘзЁӢеәҸжқҘиҜ•дёҖдёӢпјҡ
import numpy as np
from matplotlib import pyplot as plt

x = np.arange(1,11)
y = 2 * x + 5
plt.title("Matplotlib demo")
plt.xlabel("x axis caption")
plt.ylabel("y axis caption")
plt.plot(x,y)
plt.show()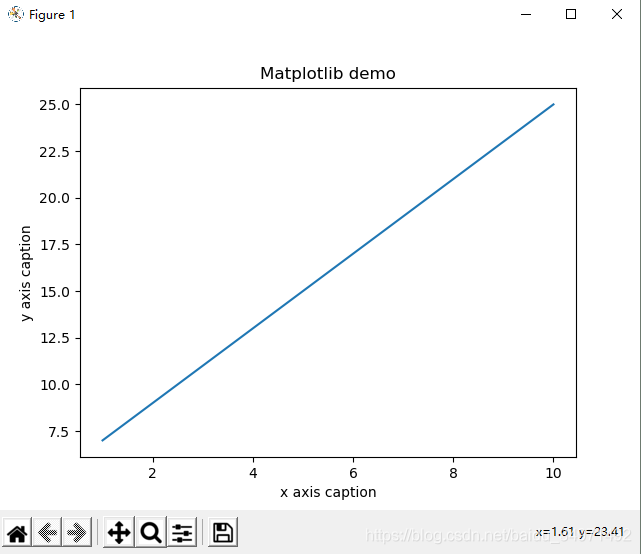
зңӢе®ҢдёҠиҝ°еҶ…е®№пјҢдҪ 们жҺҢжҸЎpython 3.9 Numpy scipyе’ҢmatlabplotеҰӮдҪ•еңЁwindowsзҺҜеўғдёӯе®үиЈ…зҡ„ж–№жі•дәҶеҗ—пјҹеҰӮжһңиҝҳжғіеӯҰеҲ°жӣҙеӨҡжҠҖиғҪжҲ–жғідәҶи§ЈжӣҙеӨҡзӣёе…іеҶ…е®№пјҢж¬ўиҝҺе…іжіЁдәҝйҖҹдә‘иЎҢдёҡиө„и®Ҝйў‘йҒ“пјҢж„ҹи°ўеҗ„дҪҚзҡ„йҳ…иҜ»пјҒ


