有一个功能需求,每天在cacti上爬取昨天一整天的流量图,并将流量图上的min、max、average流量做成表格,用邮件发出。 (python2.7.5)
1、需要使用的模块
#!/usr/bin/env python
#-*- coding: UTF-8 -*-
import time,datetime,cookielib,requests,sys,re,urllib2,urllib,socket,csv,heapq
import smtplib
import mimetypes
import time
from email.mime.text import MIMEText
from email.mime.multipart import MIMEMultipart
from email.mime.base import MIMEBase
from email import encoders
from email.MIMEImage import MIMEImage
default_encoding = 'utf-8'
if sys.getdefaultencoding() != default_encoding:
    reload(sys)
2、登陆cacti的函数
def Login1():
    socket.setdefaulttimeout(10)
    global headers
    headers={}
    cj = cookielib.CookieJar()
    global opener
    opener = urllib2.build_opener(urllib2.HTTPCookieProcessor(cj))

    # cacti使用的账号密码
    data = urllib.urlencode( {'action':'login','login_username':'admin','login_password':'123456' })
    # 打开cacti主页
    page = urllib2.Request("http://100.0.102.3/index.php", data ,headers)
    # 爬取页面数据
    html = opener.open(page).read()
    # 如果页面数据中有graph_settings.php链接,说明登陆成功(返回1),反之登陆失败(返回0)
    if re.findall("graph_settings.php",html):
        return 1
    else:
        return 0
3、再定义几个需要用到的函数
# 日期转换为时间戳(cacti的图片网址需要指定开始和结束时间)
def datetime_timestamp(dt):
     time.strptime(dt, '%Y-%m-%d %H:%M:%S')
     s = time.mktime(time.strptime(dt, '%Y-%m-%d %H:%M:%S'))
     return int(s)

# 将bit换算成Gbit/Mbit/Kbit(各级相差1000倍,保留2位小数)
def tobit(x):
    if x>=1000000000:
        return str(round(x/1000000000,2))+'G'
    elif x>=1000000:
        return str(round(x/1000000,2))+'M'
    elif x>=1000:
        return str(round(x/1000,2))+'K'
    else:
        return str(round(x,2))
4、开始抓取图片和csv(如下图,图片右边的蓝色下载箭头就是csv)。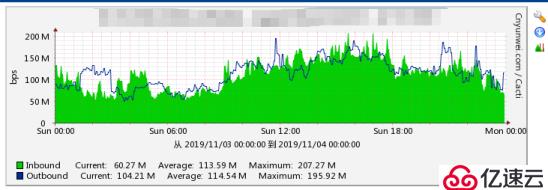
try:
# 如果登陆成功
if Login1()==1:
# 流量图的开始时间,昨天的00:00:00
start_time=str(datetime_timestamp((datetime.datetime.today()-datetime.timedelta(days=1)).strftime('%Y-%m-%d 00:00:00')))
# 流量图的结束时间,今天的00:00:00
end_time=str(datetime_timestamp(datetime.datetime.today().strftime('%Y-%m-%d 00:00:00')))
# 昨天一整天的流量图网址(2687是图片id)
url1="http://100.0.102.3/graph_image.php?action=zoom&local_graph_id=2687&rra_id=0&view_type=&graph_start="+start_time+"&graph_end="+end_time
# 下载图片,保存到本地
request = urllib2.Request(url1, None ,headers)
res = opener.open(request).read()
f=open("/myftpdir/2687.png","wb")
f.write(res)
f.close()
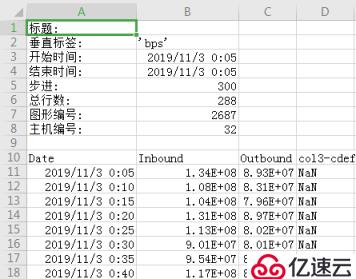
# 下载图片对应的csv(用于读取max、min等数值)
url2="http://100.0.102.3/graph_xport.php?local_graph_id=2687&rra_id=0&view_type=&graph_start="+start_time+"&graph_end="+end_time
request = urllib2.Request(url2, None ,headers)
res = opener.open(request).read()
f=open("/myftpdir/2687.csv","wb")
f.write(res)
f.close()
# 读取这个csv文件
f=open('/myftpdir/2687.csv','rb')
reader = csv.reader(f)
# csv保存了每5分钟的平均上传(outbound)和下载(inbound)速率(共288行),生成2个列表来存储所有的上传速率和下载速率
inbounds=[]
outbounds=[]
n=0
for row in reader:
# 该表格的第11行到298行是速率
if n>=10 and n<=297:
# 如果数据显示NaN,则表示cacti当时获取数据失败,这种情况不做存储
# csv第1列是时间,第2列是inbound,第3列是outbound
if row[1]!='NaN':
inbounds.append(float(row[1]))
if row[2]!='NaN':
outbounds.append(float(row[2]))
n+=1
# inbound平均速率=inbounds列表的所有速率总和/列表长度(就是存储的速率个数),并换算单位
inbound_ave1=tobit(float(reduce(lambda x,y:x+y,inbounds)/len(inbounds)))
# inbounds列表的最小值
inbound_min1=tobit(heapq.nsmallest(1,inbounds)[0])
# inbounds列表的最大值
inbound_max1=tobit(heapq.nlargest(1,inbounds)[0])
# 同样方法计算outbound的平均速率、最大速率、最小速率
outbound_min1=tobit(heapq.nsmallest(1,outbounds)[0])
outbound_max1=tobit(heapq.nlargest(1,outbounds)[0])
outbound_ave1=tobit(float(reduce(lambda x,y:x+y,outbounds)/len(outbounds)))5、发送邮件
# 指定发件人、收件人、标题等
msg = MIMEMultipart('related')
msg['From'] = "1111111@qq.com"
# 邮件标题按要求做成”X年X月X日报表“
msg['Subject'] =str((datetime.datetime.today()-datetime.timedelta(days=1)).strftime('%Y'))+u'年'+str((datetime.datetime.today()-datetime.timedelta(days=1)).strftime('%m'))+u'月'+str((datetime.datetime.today()-datetime.timedelta(days=1)).strftime('%d'))+u'日报表'
msg['To']="111111@qq.com"
toaddrs = [msg['To']]
msgAlternative = MIMEMultipart('alternative')
msg.attach(msgAlternative)
# 流量图加入邮件正文
fp = open('/myftpdir/2687.png', 'rb')
msgImage = MIMEImage(fp.read())
fp.close()
msgImage.add_header('Content-ID', '<image1>')
msg.attach(msgImage)
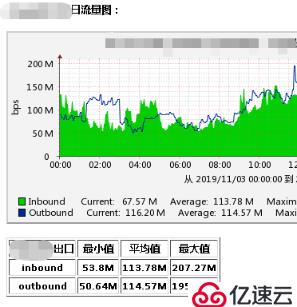
# 邮件正文,因为要添加图片和表格,所以不能用纯文本格式,改用html格式
msgText = MIMEText('''
<h5>流量图:</h5>
<img src="cid:image1">
<br>
<table border="1">
<tr>
<th>出口</th>
<th>最小值</th>
<th>平均值</th>
<th>最大值</th>
</tr>
<tr>
<th>inbound</th>
<th>%s</th>
<th>%s</th>
<th>%s</th>
</tr>
<tr>
<th>outbound</th>
<th>%s</th>
<th>%s</th>
<th>%s</th>
</tr>
</table>
''' % (inbound_min1,inbound_ave1,inbound_max1,outbound_min1,outbound_ave1,outbound_max1), 'html', 'utf-8')
msgAlternative.attach(msgText)
# 连接邮箱服务器
server = smtplib.SMTP()
server.connect('smtp.qq.com',25)
server.ehlo()
server.login('111111@qq.com','123456')
server.sendmail(msg['From'],toaddrs,msg.as_string())
server.quit()
except:
# 登陆失败
pass
邮件内容:
免责声明:本站发布的内容(图片、视频和文字)以原创、转载和分享为主,文章观点不代表本网站立场,如果涉及侵权请联系站长邮箱:is@yisu.com进行举报,并提供相关证据,一经查实,将立刻删除涉嫌侵权内容。


