小编给大家分享一下Matplotlib如何绘制混淆矩阵,希望大家阅读完这篇文章之后都有所收获,下面让我们一起去探讨吧!
代码如下:
import itertools
import matplotlib.pyplot as plt
import numpy as np
# 绘制混淆矩阵
def plot_confusion_matrix(cm, classes, normalize=False, title='Confusion matrix', cmap=plt.cm.Blues):
"""
- cm : 计算出的混淆矩阵的值
- classes : 混淆矩阵中每一行每一列对应的列
- normalize : True:显示百分比, False:显示个数
"""
if normalize:
cm = cm.astype('float') / cm.sum(axis=1)[:, np.newaxis]
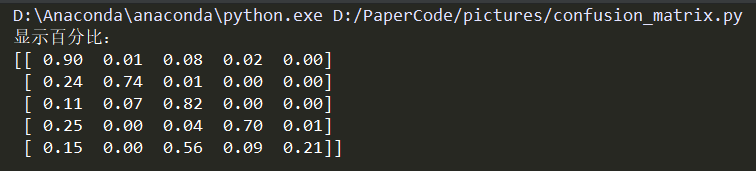
print("显示百分比:")
np.set_printoptions(formatter={'float': '{: 0.2f}'.format})
print(cm)
else:
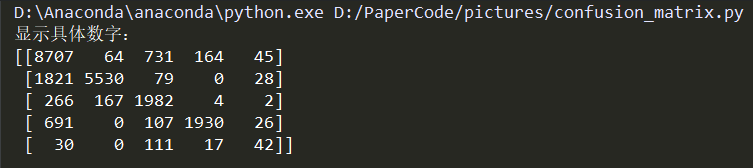
print('显示具体数字:')
print(cm)
plt.imshow(cm, interpolation='nearest', cmap=cmap)
plt.title(title)
plt.colorbar()
tick_marks = np.arange(len(classes))
plt.xticks(tick_marks, classes, rotation=45)
plt.yticks(tick_marks, classes)
# matplotlib版本问题,如果不加下面这行代码,则绘制的混淆矩阵上下只能显示一半,有的版本的matplotlib不需要下面的代码,分别试一下即可
plt.ylim(len(classes) - 0.5, -0.5)
fmt = '.2f' if normalize else 'd'
thresh = cm.max() / 2.
for i, j in itertools.product(range(cm.shape[0]), range(cm.shape[1])):
plt.text(j, i, format(cm[i, j], fmt),
horizontalalignment="center",
color="white" if cm[i, j] > thresh else "black")
plt.tight_layout()
plt.ylabel('True label')
plt.xlabel('Predicted label')
plt.show()测试数据:
cnf_matrix = np.array([[8707, 64, 731, 164, 45],
                      [1821, 5530, 79, 0, 28],
                      [266, 167, 1982, 4, 2],
                      [691, 0, 107, 1930, 26],
                      [30, 0, 111, 17, 42]])
attack_types = ['Normal', 'DoS', 'Probe', 'R2L', 'U2R']
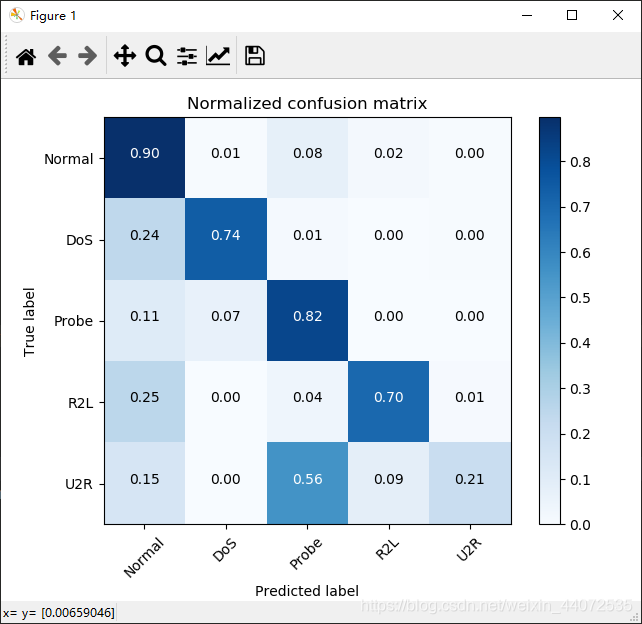
plot_confusion_matrix(cnf_matrix, classes=attack_types, normalize=True, title='Normalized confusion matrix')
效果:
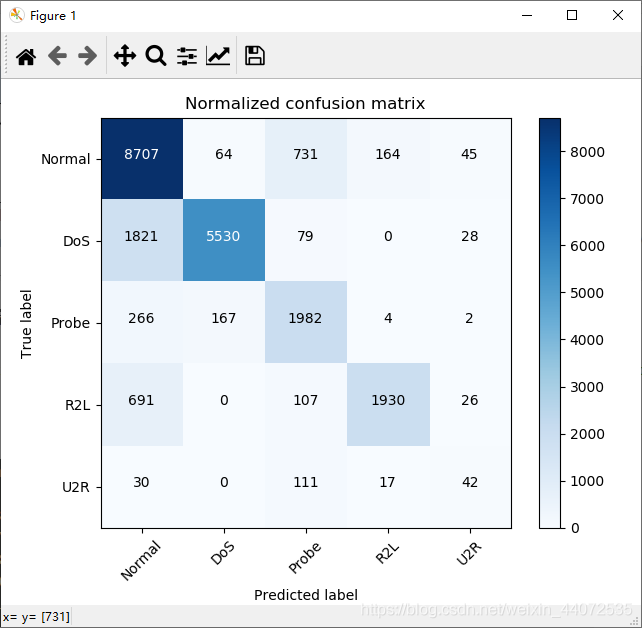
plot_confusion_matrix(cnf_matrix, classes=attack_types, normalize=False, title='Normalized confusion matrix')
效果:
看完了这篇文章,相信你对“Matplotlib如何绘制混淆矩阵”有了一定的了解,如果想了解更多相关知识,欢迎关注亿速云行业资讯频道,感谢各位的阅读!
免责声明:本站发布的内容(图片、视频和文字)以原创、转载和分享为主,文章观点不代表本网站立场,如果涉及侵权请联系站长邮箱:is@yisu.com进行举报,并提供相关证据,一经查实,将立刻删除涉嫌侵权内容。


