这篇文章主要介绍“Python数据可视化举例分析”,在日常操作中,相信很多人在Python数据可视化举例分析问题上存在疑惑,小编查阅了各式资料,整理出简单好用的操作方法,希望对大家解答”Python数据可视化举例分析”的疑惑有所帮助!接下来,请跟着小编一起来学习吧!
01 网页分析
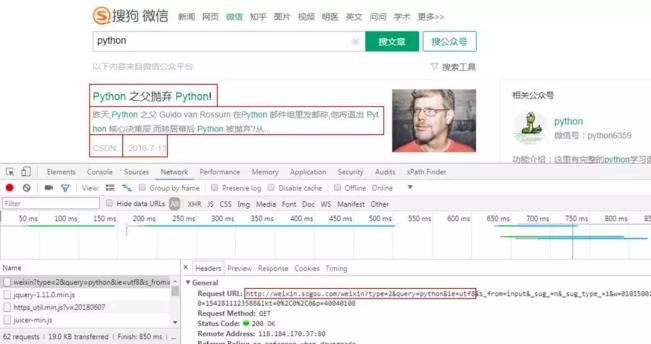
获取微信公众号文章信息,标题、开头、公众号、发布时间。
请求方式为GET,请求网址为红框部分,后面的信息没什么用。
02 反爬破解
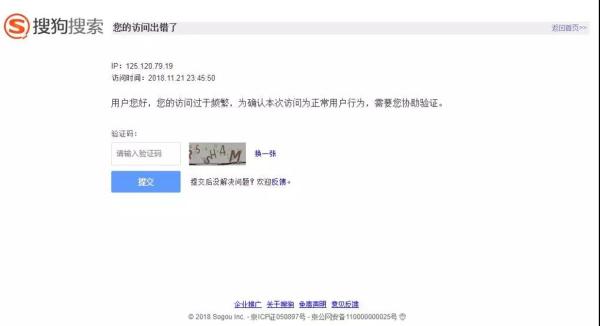
什么时候出现上图这种情况呢?
两种,一种同一个IP重复访问页面,另一种同一个Cookies重复访问页面。
两个都有,挂的更快!完整爬取我只成功了一次...
因为我最开始就是先什么都不设置,然后就出现验证码页面。然后用了代理IP,还是会跳转验证码页面,直到***改变Cookies,才成功爬取。
01 代理IP设置
def get_proxies(i): """ 获取代理IP """ df = pd.read_csv('sg_effective_ip.csv', header=None, names=["proxy_type", "proxy_url"]) proxy_type = ["{}".format(i) for i in np.array(df['proxy_type'])] proxy_url = ["{}".format(i) for i in np.array(df['proxy_url'])] proxies = {proxy_type[i]: proxy_url[i]} return proxies代理的获取以及使用这里就不赘述了,前面的文章有提到,有兴趣的小伙伴可以自行去看看。
经过我两天的实践,免费IP确实没什么用,两下子就把我真实IP揪出来了。
02 Cookies设置
def get_cookies_snuid(): """ 获取SNUID值 """ time.sleep(float(random.randint(2, 5))) url = "http://weixin.sogou.com/weixin?type=2&s_from=input&query=python&ie=utf8&_sug_=n&_sug_type_=" headers = {"Cookie": "ABTEST=你的参数;IPLOC=CN3301;SUID=你的参数;SUIR=你的参数"} # HEAD请求,请求资源的首部 response = requests.head(url, headers=headers).headers result = re.findall('SNUID=(.*?); expires', response['Set-Cookie']) SNUID = result[0] return SNUID总的来说,Cookies的设置是整个反爬中最重要的,而其中的关键便是动态改变SNUID值。
这里就不详细说其中缘由,毕竟我也是在网上看大神的帖子才领悟到的,而且领悟的还很浅。
成功爬取100页就只有一次,75页,50页,甚至到***一爬就挂的情况都出现了...
我可不想身陷「爬-反爬-反反爬」的泥潭之中,爬虫之后的事情才是我的真正目的,比如数据分析,数据可视化。
所以干票大的赶紧溜,只能膜拜搜狗工程师。
03 数据获取
1 构造请求头
head = """ Accept:text/html,application/xhtml+xml,application/xml;q=0.9,image/webp,image/apng,*/*;q=0.8 Accept-Encoding:gzip, deflate Accept-Language:zh-CN,zh;q=0.9 Connection:keep-alive Host:weixin.sogou.com Referer:'http://weixin.sogou.com/', Upgrade-Insecure-Requests:1 User-Agent:Mozilla/5.0 (Windows NT 6.1; WOW64) AppleWebKit/537.36 (KHTML, like Gecko) Chrome/63.0.3239.132 Safari/537.36 """ # 不包含SNUID值 cookie = '你的Cookies' def str_to_dict(header): """ 构造请求头,可以在不同函数里构造不同的请求头 """ header_dict = {} header = header.split('\n') for h in header: h = h.strip() if h: k, v = h.split(':', 1) header_dict[k] = v.strip() return header_dict2 获取网页信息
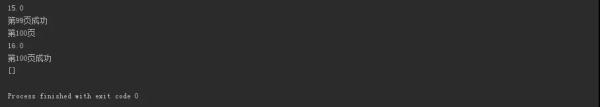
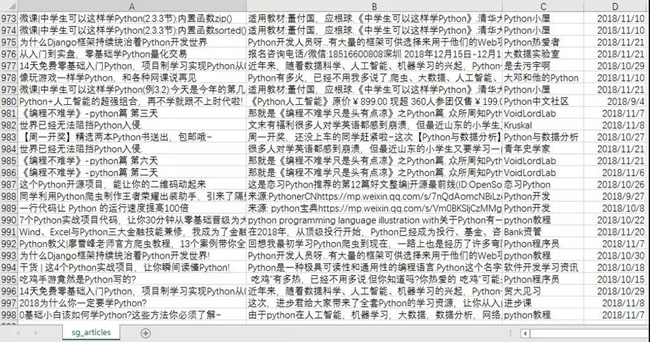
def get_message(): """ 获取网页相关信息 """ failed_list = [] for i in range(1, 101): print('第' + str(i) + '页') print(float(random.randint(15, 20))) # 设置延时,这里是度娘查到的,说要设置15s延迟以上,不会被封 time.sleep(float(random.randint(15, 20))) # 每10页换一次SNUID值 if (i-1) % 10 == 0: value = get_cookies_snuid() snuid = 'SNUID=' + value + ';' # 设置Cookies cookies = cookie + snuid url = 'http://weixin.sogou.com/weixin?query=python&type=2&page=' + str(i) + '&ie=utf8' host = cookies + '\n' header = head + host headers = str_to_dict(header) # 设置代理IP proxies = get_proxies(i) try: response = requests.get(url=url, headers=headers, proxies=proxies) html = response.text soup = BeautifulSoup(html, 'html.parser') data = soup.find_all('ul', {'class': 'news-list'}) lis = data[0].find_all('li') for j in (range(len(lis))): h4 = lis[j].find_all('h4') #print(h4[0].get_text().replace('\n', '')) title = h4[0].get_text().replace('\n', '').replace(',', ',') p = lis[j].find_all('p') #print(p[0].get_text()) article = p[0].get_text().replace(',', ',') a = lis[j].find_all('a', {'class': 'account'}) #print(a[0].get_text()) name = a[0].get_text() span = lis[j].find_all('span', {'class': 's2'}) cmp = re.findall("\d{10}", span[0].get_text()) #print(time.strftime("%Y-%m-%d", time.localtime(int(cmp[0]))) + '\n') date = time.strftime("%Y-%m-%d", time.localtime(int(cmp[0]))) with open('sg_articles.csv', 'a+', encoding='utf-8-sig') as f: f.write(title + ',' + article + ',' + name + ',' + date + '\n') print('第' + str(i) + '页成功') except Exception as e: print('第' + str(i) + '页失败') failed_list.append(i) continue # 获取失败页码 print(failed_list) def main(): get_message() if __name__ == '__main__': main()***成功获取数据。
04 数据可视化
1 微信文章发布数量***0
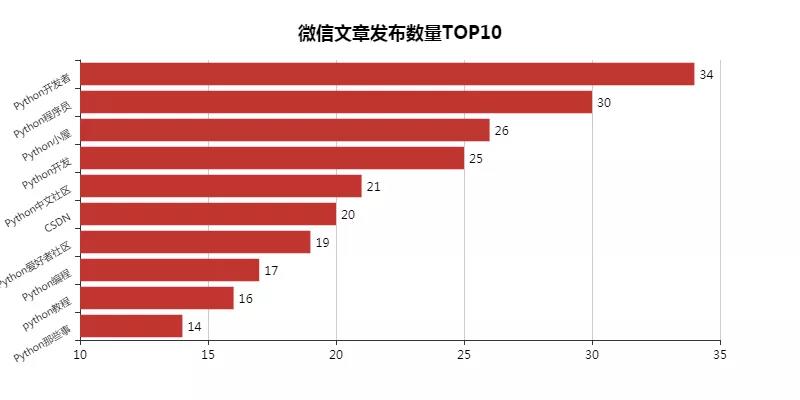
这里对搜索过来的微信文章进行排序,发现了这十位Python大佬。
这里其实特想知道他们是团队运营,还是个人运营。不过不管了,先关注去。
这个结果可能也与我用Python这个关键词去搜索有关,一看公众号名字都是带有Python的(CSDN例外)。
from pyecharts import Bar import pandas as pd df = pd.read_csv('sg_articles.csv', header=None, names=["title", "article", "name", "date"]) list1 = [] for j in df['date']: # 获取文章发布年份 time = j.split('-')[0] list1.append(time) df['year'] = list1 # 选取发布时间为2018年的文章,并对其统计 df = df.loc[df['year'] == '2018'] place_message = df.groupby(['name']) place_com = place_message['name'].agg(['count']) place_com.reset_index(inplace=True) place_com_last = place_com.sort_index() dom = place_com_last.sort_values('count', ascending=False)[0:10] attr = dom['name'] v1 = dom['count'] bar = Bar("微信文章发布数量***0", title_pos='center', title_top='18', width=800, height=400) bar.add("", attr, v1, is_convert=True, xaxis_min=10, yaxis_rotate=30, yaxis_label_textsize=10, is_yaxis_boundarygap=True, yaxis_interval=0, is_label_show=True, is_legend_show=False, label_pos='right', is_yaxis_inverse=True, is_splitline_show=False) bar.render("微信文章发布数量***0.html")2 微信文章发布时间分布
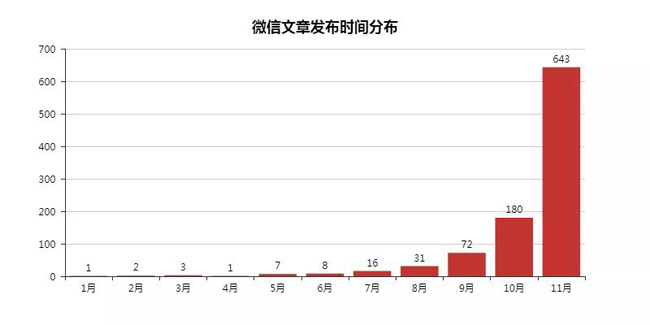
因为这里发现搜索到的文章会有2018年以前的,这里予以删除,并且验证剩下文章的发布时间。
毕竟信息讲究时效性,如果我搜索获取的都是老掉牙的信息,就没什么意思了,更何况还是在一直在变化的互联网行业。
import numpy as np import pandas as pd from pyecharts import Bar df = pd.read_csv('sg_articles.csv', header=None, names=["title", "article", "name", "date"]) list1 = [] list2 = [] for j in df['date']: # 获取文章发布年份及月份 time_1 = j.split('-')[0] time_2 = j.split('-')[1] list1.append(time_1) list2.append(time_2) df['year'] = list1 df['month'] = list2 # 选取发布时间为2018年的文章,并对其进行月份统计 df = df.loc[df['year'] == '2018'] month_message = df.groupby(['month']) month_com = month_message['month'].agg(['count']) month_com.reset_index(inplace=True) month_com_last = month_com.sort_index() attr = ["{}".format(str(i) + '月') for i in range(1, 12)] v1 = np.array(month_com_last['count']) v1 = ["{}".format(int(i)) for i in v1] bar = Bar("微信文章发布时间分布", title_pos='center', title_top='18', width=800, height=400) bar.add("", attr, v1, is_stack=True, is_label_show=True) bar.render("微信文章发布时间分布.html")3 标题、文章开头词云
from wordcloud import WordCloud, ImageColorGenerator import matplotlib.pyplot as plt import pandas as pd import jieba df = pd.read_csv('sg_articles.csv', header=None, names=["title", "article", "name", "date"]) text = '' # for line in df['article'].astype(str):(前文词云代码) for line in df['title']: text += ' '.join(jieba.cut(line, cut_all=False)) backgroud_Image = plt.imread('python_logo.jpg') wc = WordCloud( background_color='white', mask=backgroud_Image, font_path='C:\Windows\Fonts\STZHONGS.TTF', max_words=2000, max_font_size=150, random_state=30 ) wc.generate_from_text(text) img_colors = ImageColorGenerator(backgroud_Image) wc.recolor(color_func=img_colors) plt.imshow(wc) plt.axis('off') # wc.to_file("文章.jpg")(前文词云代码) wc.to_file("标题.jpg") print('生成词云成功!')到此,关于“Python数据可视化举例分析”的学习就结束了,希望能够解决大家的疑惑。理论与实践的搭配能更好的帮助大家学习,快去试试吧!若想继续学习更多相关知识,请继续关注亿速云网站,小编会继续努力为大家带来更多实用的文章!
免责声明:本站发布的内容(图片、视频和文字)以原创、转载和分享为主,文章观点不代表本网站立场,如果涉及侵权请联系站长邮箱:is@yisu.com进行举报,并提供相关证据,一经查实,将立刻删除涉嫌侵权内容。


