这篇文章主要介绍Python如果实现图形绘制,文中介绍的非常详细,具有一定的参考价值,感兴趣的小伙伴们一定要看完!
第一个图形从简单的开始。
# importing the required module

import matplotlib.pyplot as plt


# x axis values

x = [1,2,3]

# corresponding y axis values

y = [2,4,1]


# plotting the points

plt.plot(x, y)


# naming the x axis

plt.xlabel('x - axis')

# naming the y axis

plt.ylabel('y - axis')


# giving a title to my graph

plt.title('My first graph!')


# function to show the plot

plt.show()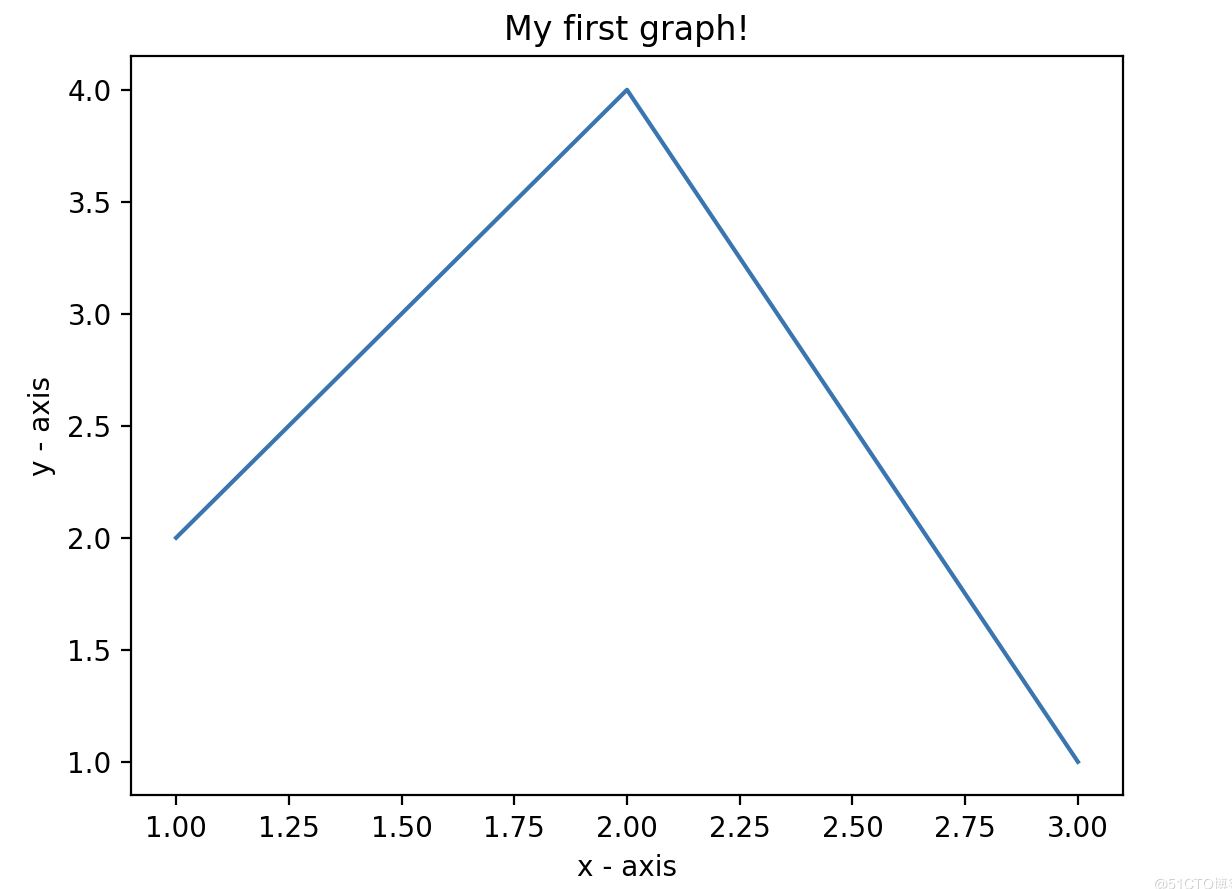
1)将 x 轴和相应的 y 轴值定义为列表。
2)使用 .plot() 函数在画布上绘制它们。
3)使用 .xlabel() 和 .ylabel() 函数为 x 轴和 y 轴命名。
4)使用 .title() 函数为绘图命名。
5)使用 .show() 函数查看绘图。
2、在同一图上绘制两条或多条线
如果想在同一张图上再绘制多条线,可反复使用.plot()函数。
import matplotlib.pyplot as plt


# line 1 points

x1 = [1,2,3]

y1 = [2,4,1]

# plotting the line 1 points

plt.plot(x1, y1, label = "line 1")


# line 2 points

x2 = [1,2,3]

y2 = [4,1,3]

# plotting the line 2 points

plt.plot(x2, y2, label = "line 2")


# naming the x axis

plt.xlabel('x - axis')

# naming the y axis

plt.ylabel('y - axis')

# giving a title to my graph

plt.title('Two lines on same graph!')


# show a legend on the plot

plt.legend()


# function to show the plot

plt.show()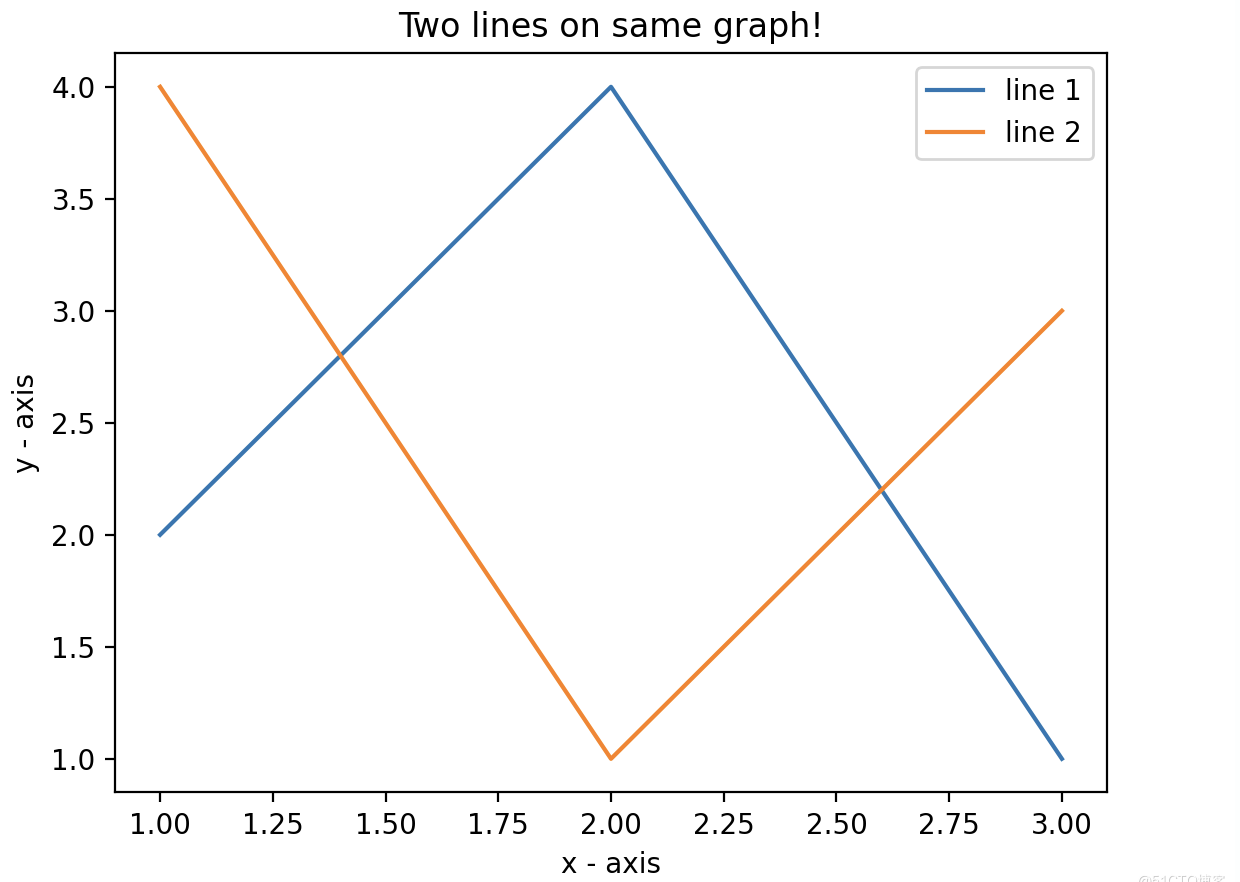
1)在同一张图上绘制两条线。 通过给它们一个名称(label)来区分它们,该名称作为 .plot() 函数的参数传递。
2)提供有关线条类型及其颜色信息的小矩形框称为图例。 可以使用 .legend() 函数为绘图添加图例。
下面将讨论适用于几乎所有场景的一些基本自定义。
import matplotlib.pyplot as plt


# x axis values

x = [1,2,3,4,5,6]

# corresponding y axis values

y = [2,4,1,5,2,6]


# plotting the points

plt.plot(x, y, color='green', linestyle='dashed', linewidth = 3,marker='o', markerfacecolor='blue', markersize=12)


# setting x and y axis range

plt.ylim(1,8)

plt.xlim(1,8)


# naming the x axis

plt.xlabel('x - axis')

# naming the y axis

plt.ylabel('y - axis')


# giving a title to my graph

plt.title('Some cool customizations!')


# function to show the plot

plt.show()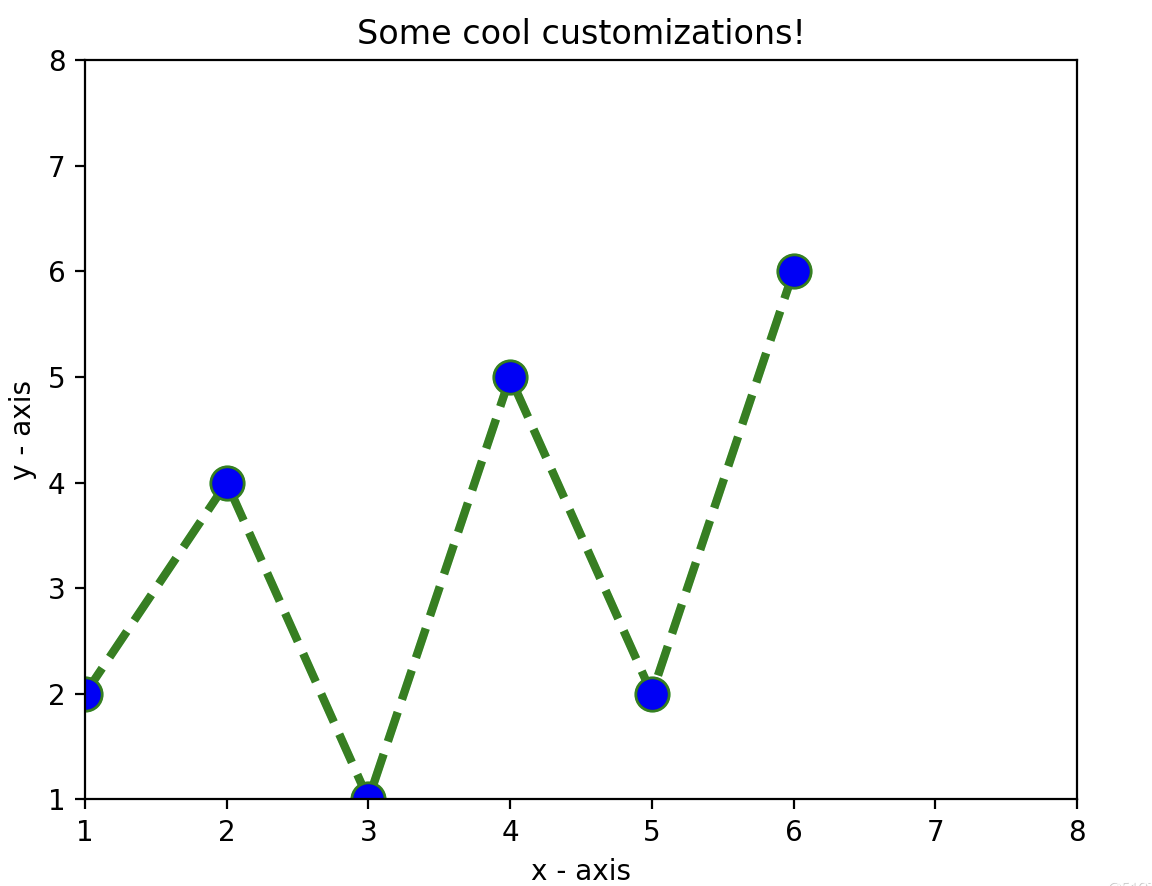
如上面代码所示,我们进行了一些自定义的改变:
1)设定线的宽度、样式以及颜色。
2)设定了标记的形状、颜色和尺寸。
3)覆盖 x 和 y 轴范围。如果未完成覆盖,pyplot 模块使用自动缩放功能来设置轴范围和比例。
以上是“Python如果实现图形绘制”这篇文章的所有内容,感谢各位的阅读!希望分享的内容对大家有帮助,更多相关知识,欢迎关注亿速云行业资讯频道!
免责声明:本站发布的内容(图片、视频和文字)以原创、转载和分享为主,文章观点不代表本网站立场,如果涉及侵权请联系站长邮箱:is@yisu.com进行举报,并提供相关证据,一经查实,将立刻删除涉嫌侵权内容。


