这篇文章主要介绍了Python中怎么安装和使用pyinstrument的相关知识,内容详细易懂,操作简单快捷,具有一定借鉴价值,相信大家阅读完这篇Python中怎么安装和使用pyinstrument文章都会有所收获,下面我们一起来看看吧。
程序的性能也是非常关键的指标,很多时候你的代码跑的快,更能够体现你的技术。最近发现很多小伙伴在性能分析的过程中都是手动打印运行时间的方式来统计代码耗时的:
import datetime
start=datetime.datetime.now()
b=[i for i in range(10000000)]  # 生成长度为一千万的列表
end=datetime.datetime.now()
print(end-start)
输出结果
0:00:00.377766
这种方法使用很快捷,但需要统计每行代码的执行时间,生成可视化的报告等更完善的性能分析时就有点力不从心了。这个时候可以使用python的第三方库Pyinstrument来进行性能分析。
Pyinstrument 是一个 Python 分析器。分析器是一种帮助您优化代码的工具 - 使其更快。要获得最大的速度提升。
Pyinstrument 官方文档:pyinstrument
Pyinstrument 安装:
pip install pyinstrument
1. 举例
对于最开始我们举的例子,使用Pyinstrument实现的代码如下:
文末添加个人VX,获取资料和免费答疑

from pyinstrument import Profiler
profiler=Profiler()
profiler.start()
b=[i for i in range(10000000)]# 生成长度为一千万的列表
profiler.stop()
profiler.print()
输出结果
  _     ._   __/__   _ _  _  _ _/_   Recorded: 10:39:54  Samples:  1
 /_//_/// /_\ / //_// / //_'/ //     Duration: 0.385     CPU time: 0.391
/   _/                      v4.1.1

Program: D:/code/server/aitestdemo/test2.py

0.385 <module>  test2.py:2  #执行总耗时
└─ 0.385 <listcomp>  test2.py:7 #单行代码耗时
打印的信息包含了记录时间、线程数、总耗时、单行代码耗时、CPU执行时间等信息。
在多行代码分析的情况下的使用效果(分别统计生成一千万长度、一亿长度、两亿长度的列表耗时):
from pyinstrument import Profiler

profiler = Profiler()
profiler.start()
a = [i for i in range(10000000)]  # 生成长度为一千万的列表
b = [i for i in range(100000000)]  # 生成长度为一亿的列表
c = [i for i in range(200000000)]  # 生成长度为十亿的列表
profiler.stop()
profiler.print()
输出结果
Program: D:/code/server/aitestdemo/test2.py

16.686 <module>  test2.py:1
├─ 12.178 <listcomp>  test2.py:9
├─ 4.147 <listcomp>  test2.py:8
└─ 0.358 <listcomp>  test2.py:7
2. Pyinstrument分析django代码
使用Pyinstrument分析 Django 代码非常简单,只需要在 Django 的配置文件settings.py的 MIDDLEWARE 中添加如下配置:
MIDDLEWARE = [
	...
    'pyinstrument.middleware.ProfilerMiddleware',
	...
]
然后就可以在 url 上加一个参数 profile 就可以:
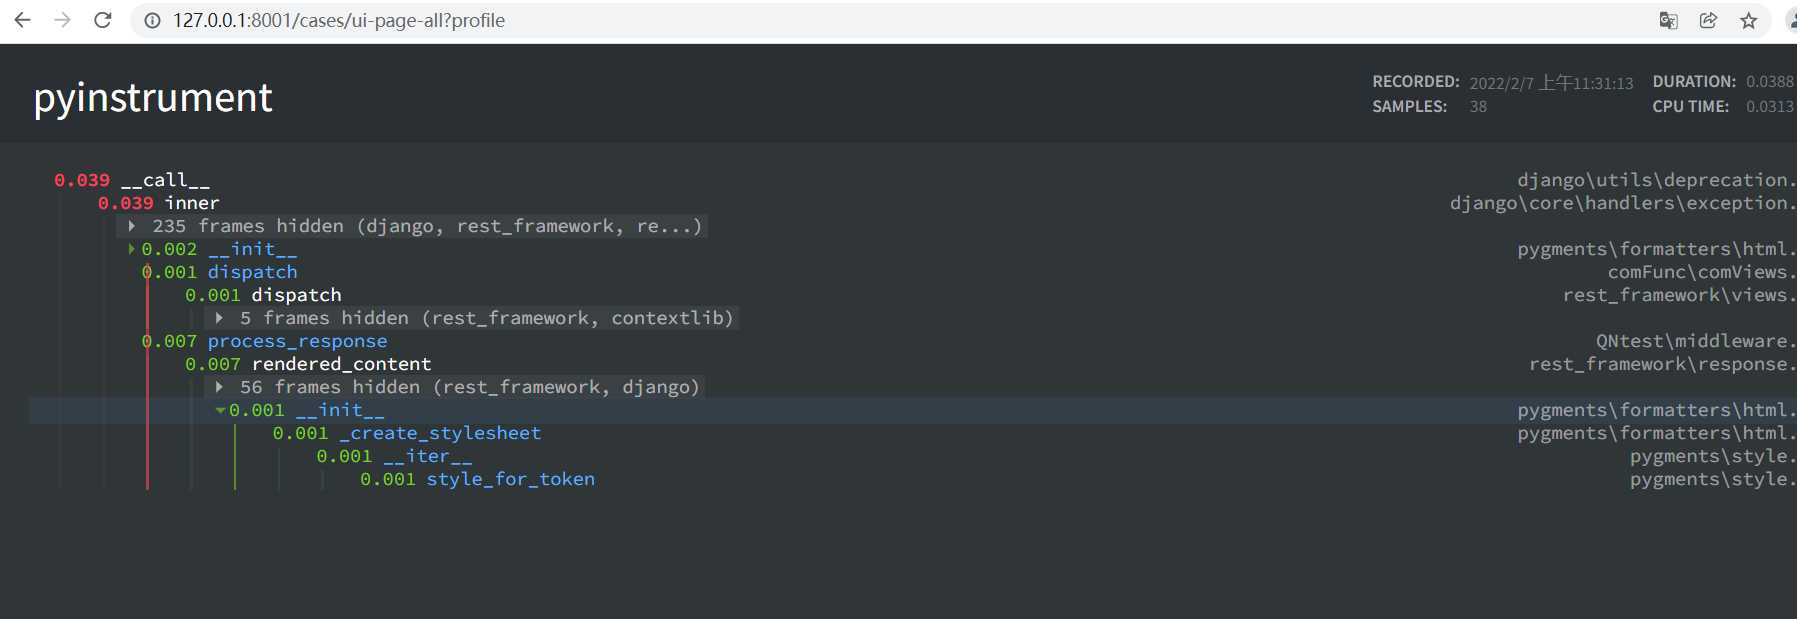
Pyinstrument还支持flask、异步代码的性能分析,具体可以查看官方文档进行学习。
Pyinstrument也提供了丰富的api供我们使用,官网文档有详细的介绍:https://pyinstrument.readthedocs.io/en/latest/reference.html
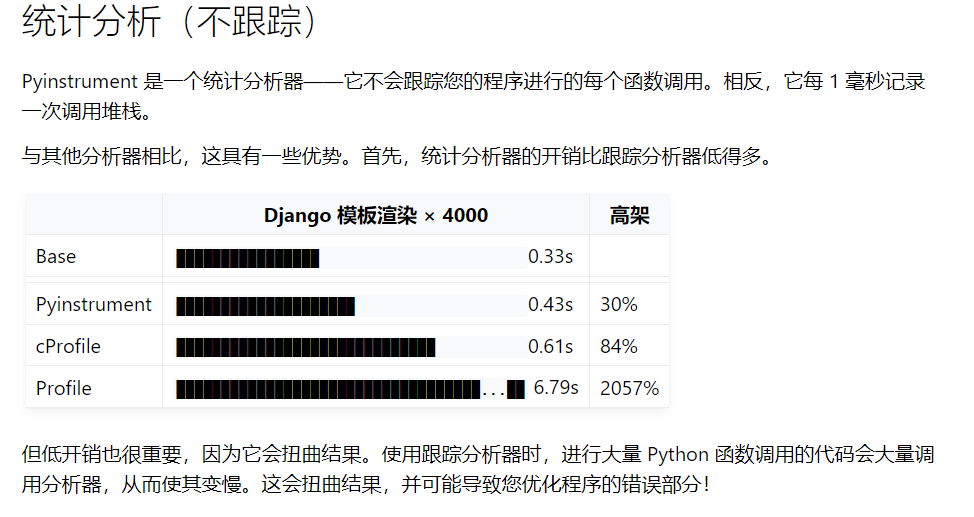
根据官方文档的描述来看,Pyinstrument的系统开销会比cProfile 这类跟踪分析器小很多,cProfile由于大量调用探查器,可能会扭曲测试结果:
关于“Python中怎么安装和使用pyinstrument”这篇文章的内容就介绍到这里,感谢各位的阅读!相信大家对“Python中怎么安装和使用pyinstrument”知识都有一定的了解,大家如果还想学习更多知识,欢迎关注亿速云行业资讯频道。
免责声明:本站发布的内容(图片、视频和文字)以原创、转载和分享为主,文章观点不代表本网站立场,如果涉及侵权请联系站长邮箱:is@yisu.com进行举报,并提供相关证据,一经查实,将立刻删除涉嫌侵权内容。


