本篇内容主要讲解“怎么用vue-cli3+echarts实现渐变色仪表盘组件封装”,感兴趣的朋友不妨来看看。本文介绍的方法操作简单快捷,实用性强。下面就让小编来带大家学习“怎么用vue-cli3+echarts实现渐变色仪表盘组件封装”吧!
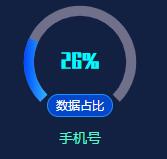
效果预览
1、使用两个仪表盘叠加,起始角度一样,底部仪表盘结束角度固定不变
2、通过props传入数据
3、计算在上层的仪表盘的结束角度并赋值
代码
<template>
  <div class="gauge">
    <div class="gauge__bottom" ref="bottomGauge"></div>
    <div class="gauge__top" ref="topGauge"></div>
    <div class="gauge__label">数据占比</div>
    <div class="gauge__title">{{ this.gaugeData.gaugeTitle }}</div>
  </div>
</template>

<script>
import echarts from "echarts";
export default {
  name: "gauge",
  props: ["gaugeData"],//传入的数据
  data() {
    return {
      bottomOption: {
        series: [
          {
            name: "",
            type: "gauge",
            startAngle: "225",
            endAngle: "-45",
            data: [{ value: 100, name: "" }],
            splitNumber: 10,
            detail: {
              show: false,
            },
            splitLine: {
              show: false,
            },
            pointer: {
              show: false,
            },
            axisTick: {
              show: false,
            },
            axisLabel: { show: false },
            axisLine: {
              lineStyle: {
                width: 10,
                color: [
                  [
                    1,
                    new echarts.graphic.LinearGradient(0, 0, 1, 0, [
                      {
                        offset: 0,
                        // 起始颜色
                        color: "#707089",
                      },
                      {
                        offset: 1,
                        // 结束颜色
                        color: "#707089",
                      },
                    ]),
                  ],
                ],
              },
            },
          },
        ],
      },
      topOption: {
        series: [
          {
            name: "业务指标",
            type: "gauge",
            startAngle: "225",
            endAngle: "",
            detail: {
              formatter: "{value}%",
              color: "#01F9FF",
              fontSize: 18,
              fontFamily: "ZhenyanGB-Regular",
              offsetCenter: [0, 0],
            },
            data: [{ value: "", name: "" }],
            splitNumber: 10,
            splitLine: {
              show: false,
            },
            pointer: {
              show: false,
            },
            axisTick: {
              show: false,
            },
            axisLabel: { show: false },
            axisLine: {
              lineStyle: {
                width: 10,
                color: "",
              },
            },
          },
        ],
      },
    };
  },
  mounted() {
    this.getTopGauge();
    this.getBottomGauge();
  },
  methods: {
    getTopGauge() {
      const chart = this.$refs.topGauge;
      if (chart) {
        const myChart = this.$echarts.init(chart, null, { renderer: "svg" });
        this.$once("hook:beforeDestroy", function () {
          echarts.dispose(myChart);
        });
        this.topOption.series[0].data[0].value = this.gaugeData.gaugePercent;
        this.topOption.series[0].axisLine.lineStyle.color = this.gaugeData.guageColor;
        let tmp = 225 - 270 * (this.gaugeData.gaugePercent / 100);
        this.topOption.series[0].endAngle = tmp;
        const option = this.topOption;
        myChart.setOption(option);
      }
    },
    getBottomGauge() {
      const chart = this.$refs.bottomGauge;
      if (chart) {
        const myChart = this.$echarts.init(chart, null, { renderer: "svg" });
        this.$once("hook:beforeDestroy", function () {
          echarts.dispose(myChart);
        });
        const option = this.bottomOption;
        myChart.setOption(option);
      }
    },
  },
};
</script>

<style lang="less">
.gauge {
  width: 150px;
  height: 165px;
  position: relative;
  &__top {
    position: absolute;
    top: 0;
    left: 0;
    width: 100%;
    height: 150px;
  }
  &__bottom {
    position: absolute;
    top: 0;
    left: 0;
    width: 100%;
    height: 150px;
  }
  &__label {
    position: absolute;
    height: 21px;
    width: 64px;
    background: #0547c9;
    border: 1px solid #1e92ff;
    border-radius: 11.5px;
    border-radius: 11.5px;
    bottom: 35px;
    left: 50%;
    transform: translate(-50%, 0);
    font-family: PingFangSC-Regular;
    font-size: 8px;
    color: #ffffff;
    text-align: center;
    line-height: 21px;
  }
  &__title {
    font-family: PingFangSC-Medium;
    font-size: 14px;
    color: #52f9cb;
    text-align: center;
    position: absolute;
    bottom: 5px;
    left: 50%;
    transform: translate(-50%, 0);
  }
}
</style>
到此,相信大家对“怎么用vue-cli3+echarts实现渐变色仪表盘组件封装”有了更深的了解,不妨来实际操作一番吧!这里是亿速云网站,更多相关内容可以进入相关频道进行查询,关注我们,继续学习!
免责声明:本站发布的内容(图片、视频和文字)以原创、转载和分享为主,文章观点不代表本网站立场,如果涉及侵权请联系站长邮箱:is@yisu.com进行举报,并提供相关证据,一经查实,将立刻删除涉嫌侵权内容。


