iostat http://sebastien.godard.pagesperso-orange.fr/man_iostat.html
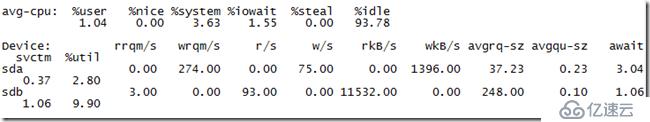
以上图为例查看sdb的IO情况
r/s + w/s: 就是当前的IOPS #### (93+0=93)
avgrq-sz:平均每次设备I/O操作的数据大小(扇区)#### (248.0)
avgqu-sz :平均I/O队列长度 ####(0.10)
await:请求队列中等待时间+svctm(服务时间) 单位是毫秒,按照每次IO平均。####(1.06)
The average time (in milliseconds) for I/O requests issued to the device to be served.
This includes the time spent by the requests in queue and the time spent servicing them.
svctm:平均每次设备I/O操作的服务时间(毫秒) ####(1.06)
svctm已经被官方注明不可信,仅供参考.因为iostat各值基本都是计算出来的,而svctm计算方法存在错误的地方
The average service time (in milliseconds) for I/O requests that were issued to the device.
Warning! Do not trust this field any more. This field will be removed in a future sysstat version.
%util: (bandwidth utilization for the device)平均有百分之多少的时间用于I/O操作,或者说有多少时间I/O队列是非空的###(9.90)
如果%util接近100%,表明I/O请求太多,I/O系统已经满负荷,磁盘可能存在瓶颈,一般%util大于70%,I/O压力就比较大,读取速度有较多的wait。
注意:如果存储设备是RAID或SSD之类的,这个说法已经不准确了
可以结合vmstat查看查看b值(等待资源的进程数)和wa值(I/O等待所占用的CPU时间的百分比,高过30%时I/O压力高)
Percentage of elapsed time during which I/O requests were issued to the device (bandwidth utilization for the device).
Device saturation occurs when this value is close to 100% for devices serving requests serially.
But for devices serving requests in parallel, such as RAID arrays and modern SSDs, this number does not reflect their performance limits.
avgqu-sz:(队列长度)可作为衡量系统I/O负荷的指标, 超过处理能力的请求数目,待处理的 I/O 请求,当请求持续超出磁盘处理能力,该值将增加。
但由于avcqu-sz是按照单位时间的平均值,所以不能反映瞬间的I/O洪水。应结合参考svctm.以及r/s及w/s。
svctm的大小一般和磁盘性能有关,CPU/内存的负荷也会对其有影响,请求过多也会间接导致svctm的增加。
await的大小一般取决于服务时间(svctm)以及I/O队列的长度和I/O请求的发出模式。
如果await比较接近svctm,说明I/O几乎没有等待时间;如果await远大于svctm,说明I/O队列太长,应用得到的响应时间变慢,
如果响应时间超过了用户可以容许的范围,这时可以考虑更换更快的磁盘,调整内核elevator算法,优化应用,或者升级CPU
免责声明:本站发布的内容(图片、视频和文字)以原创、转载和分享为主,文章观点不代表本网站立场,如果涉及侵权请联系站长邮箱:is@yisu.com进行举报,并提供相关证据,一经查实,将立刻删除涉嫌侵权内容。


