I/O子系统是SQL Server性能的重要组成部分。当我们为SQL Server配置一台新的服务器,或者添加或修改已有系统的磁盘配置时,都需要判断I/O子系统的性能。
测试I/O读写的块大小,需要区分顺序读写与随机读写(sequential/random)。
(1)顺序I/O
对于顺序I/O,块大小应当包括 8 KB、64 KB、128 KB、256 KB、1024 KB。这是因为SQL Server企业版的“预读”Read-ahead 最高可达到1024KB。测量结果主要关注于磁盘的吞吐量(throughput),计量单位为MB/s 。
(2)随机I/O
对于随机I/O,一般仅关注于 8 KB的块。测量结果主要关注于磁盘的寻道能力,计量单位为I/Os per second(IOPs)。
对于OLTP,有以下特点:
(1)OLTP处理在本质上一般是对数据文件(mdf和ndf)随机的读与写。
(2)在大多数情况下,从本质上来说,读的活动是持续的。
(3)对数据文件的写的活动,主要是检查点(checkpoint)时才发生。检查点的频率是由恢复间隔设置(recovery interval settings)决定的。
(4)事务日志的写,从本质上说,是连续的、无固定大小的,依赖于工作负荷的性质(sector aligned up to 60 KB)。
(5)事务日志的读,从本质上说,是连续的(sector aligned up to 120 KB)。
Microsoft官方针对SQL Server 2005发布了一个最佳实践的白皮书,推荐以下3种工具。 http://technet.microsoft.com/zh-cn/library/cc966412.aspx
一、SQLIO
1. 安装SQLIO
SQLIO是Microsoft官方的硬盘压力测试工具,用于测试磁盘的IOPS(Input/Output per second)值。此工具尽管并不是针对SQL Server工作模式来设计的,但是仍然可以用来诊断与SQL Server相关的一些I/O类型的性能,可以测量磁盘的IOPs、吞吐量 (MB/s)和延迟时间。
首先需要到微软的官网下载 SQLIO Disk Subsystem Benchmark Tool http://www.microsoft.com/en-us/download/details.aspx?id=20163 (本文附件即是)
下载后在运行SQLIO.msi文件,进入安装向导。


2. 配置参数文件
打开安装所在的文件夹。用文本编辑工具修改param.txt,例如:
f:\testfile.dat 2 0x0 300 #d:\testfile.dat 2 0x0 100 |
每一行都有4个参数,分别为:
(1)Path to test file。测试用的文件和它的完整路径。上例表示要测试F盘的IOPS,并在F盘生成一个名为testfile.dat的测试文件。
(2)Number of threads (per test file)。测试时,同时使用多少个线程。建议和CPU的数量一致。
(3)Mask。始终为0x0 。
(4)Size of test file in MB。生成的一个测试文件的大小。
3. 运行测试
运行“命令提示符”,转到SQLIO的安装路径,运行以下命令(区分大小写):
| sqlio -kR -s360 -frandom -o8 -b8 -LS -Fparam.txt |
详细的参数如下:
-k<R|W> | kind of IO (R=reads, W=writes) |
-t<threads> | number of threads |
-s<secs> | number of seconds to run |
-d<drive1>..<driveN> | use same filename on each drive letter given |
-R<drive1>,,<driveN> | raw drive letters/number on which to run |
-f<stripe factor> | stripe size in blocks, random, or sequential |
-p[I]<cpu affinity> | cpu number for affinity (0 based)(I=ideal) |
-a[R[I]]<cpu mask> | cpu mask for (R=roundrobin (I=ideal)) affinity |
-o<#outstanding> | depth to use for completion routines |
-b<io size(KB)> | IO block size in KB |
-i<#IOs/run> | number of IOs per IO run |
-m<[C|S]><#sub-blks> | do multi blk IO (C=copy, S=scatter/gather) |
-L<[S|P][i|]> | latencies from (S=system, P=processor) timer |
-U[p] | report system (p=per processor) utilization |
-B<[N|Y|H|S]> | set buffering (N=none, Y=all, H=hdwr, S=sfwr) |
-S<#blocks> | start I/Os #blocks into file |
-v1.1.1 | I/Os runs use same blocks, as in version 1.1.1 |
-64 | use 64 bit memory operations |
-F<paramfile> | read parameters from <paramfile> |
Defaults:
-kR -t1 -s30 -f64 -b2 -i64 -BN testfile.dat
Maximums:
-t (threads): 256
no. of files, includes -d & -R: 256
filename length: 256
4. 查看结果
C:\Program Files\SQLIO>sqlio -kR -s360 -frandom -o8 -b8 -LS -Fparam.txt sqlio v1.5.SG using system counter for latency timings, 14318180 counts per second parameter file used: param.txt file F:\testfile.dat with 2 threads (0-1) using mask 0x0 (0) 2 threads reading for 360 secs from file F:\testfile.dat using 8KB random IOs enabling multiple I/Os per thread with 8 outstanding size of file F:\testfile.dat needs to be: 314572800 bytes current file size: 0 bytes need to expand by: 314572800 bytes expanding F:\testfile.dat ... done. using specified size: 300 MB for file: F:\testfile.dat initialization done CUMULATIVE DATA: throughput metrics: IOs/sec: 2209.73 MBs/sec: 73.51 latency metrics: Min_Latency(ms): 0 Avg_Latency(ms): 0 Max_Latency(ms): 107 histogram: ms: 0 1 2 3 4 5 6 7 8 9 10 11 12 13 14 15 16 17 18 19 20 21 22 23 24+ %: 98 2 0 0 0 0 0 0 0 0 0 0 0 0 0 0 0 0 0 0 0 0 0 0 0 |
重点关注输出结果中的IOs/sec和MBs/sec的值。
5. 注意事项
(1)虚拟机中的测试结果将是虚假的,因为虚拟机的硬盘映像文件的缓存机制很复杂。
(2)如果存储设备(SAN或RAID)有缓存,则param.txt文件中Size of test file in MB值必须为读写缓存的2倍至4倍。
(3)需要使用各种不同的参数测试。示例脚本如下:
::Test randmon IO's of 8K call sqlio -kW -s600 -frandom -o32 -b8 -LS -Fparam.txt call sqlio -kR -s600 -frandom -o32 -b8 -LS -Fparam.txt ::Test small sequential writes call sqlio -kW -s60 -fsequential -o1 -b4 -LS -Fparam.txt call sqlio -kW -s60 -fsequential -o1 -b8 -LS -Fparam.txt call sqlio -kW -s60 -fsequential -o1 -b16 -LS -Fparam.txt call sqlio -kW -s60 -fsequential -o1 -b32 -LS -Fparam.txt call sqlio -kW -s60 -fsequential -o1 -b64 -LS -Fparam.txt ::Test large sequential read/write call sqlio -kR -s60 -fsequential -o8 –b8 -LS -Fparam.txt call sqlio -kR -s60 -fsequential -o8 -b64 -LS -Fparam.txt call sqlio -kR -s60 -fsequential -o8 -b128 -LS -Fparam.txt call sqlio -kR -s60 -fsequential -o8 -b256 -LS -Fparam.txt call sqlio -kW -s60 -fsequential -o8 –b8 -LS -Fparam.txt call sqlio -kW -s60 -fsequential -o8 -b64 -LS -Fparam.txt call sqlio -kW -s60 -fsequential -o8 -b128 -LS -Fparam.txt call sqlio -kW -s60 -fsequential -o8 -b256 -LS -Fparam.txt |
二、SQLIOSim
1. 简介
SQLIOSim 用于验证加压后的I/O子系统的基本功能。此工具试图模拟实际的 SQL Server I/O 模式(随机读写数据文件、连续读写日志文件)并检查结果的正确性。此工具通常用于隔离 SQL Server 的硬件相关问题。
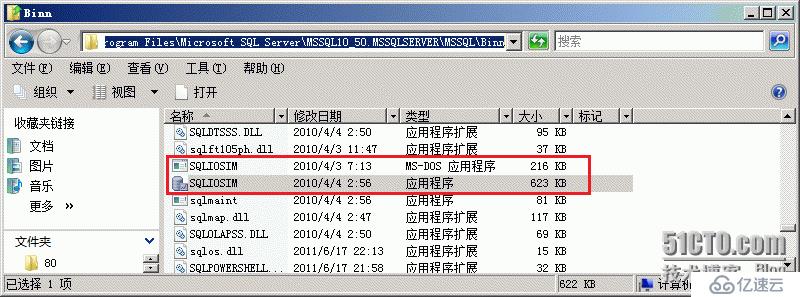
此工具默认随SQL Server同时安装,也可以到官网下载。有2个文件,一个是命令行工具,另一个是图形界面工具。
2. 图形界面
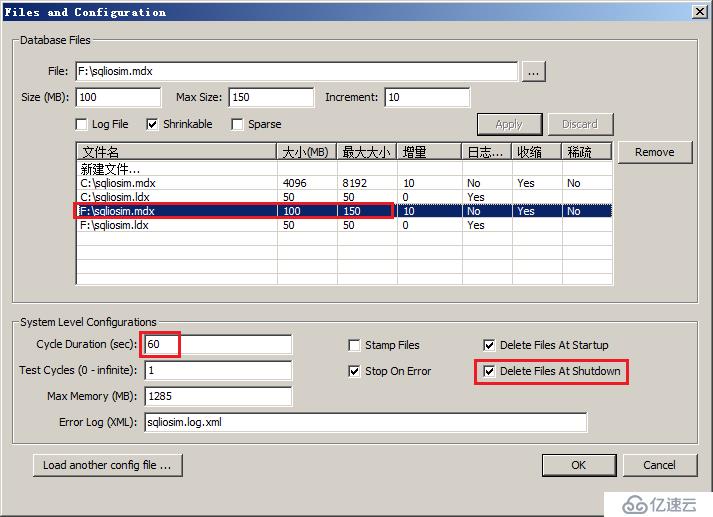
(1)配置测试文件用配置参数
“以管理员身份运行”打开图形工具。首先出现“File and Configuration”界面。默认会为每一个磁盘驱动器创建2个文件,分别模拟SQL Server的数据文件和日志文件。在下例中,修改其中一个数据文件的配置。为了自动删除测试文件,我们还要选择“Delete Files At Shutdown”。
(2)测试
完成了上述配置,就回到主界面。点一下工具栏的绿色的“Start”开始测试。

测试完成后,会出现一个提示。
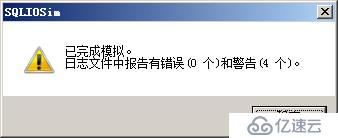
本例中出现4个警告,原因为:
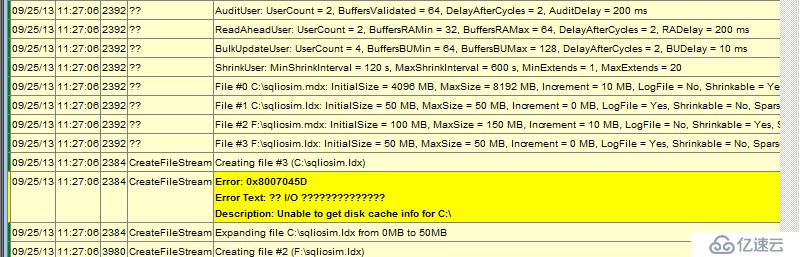
(3)查看结果
在最终结果的汇总列表中,找到刚才修改的那个测试文件相应的结果。
Test cycle complete Stopping simulation Closing file F:\sqliosim.mdx ********** Final Summary for file F:\sqliosim.mdx ********** File Attributes: Compression = No, Encryption = No, Sparse = No Target IO Duration (ms) = 100, Running Average IO Duration (ms) = 15, Number of times IO throttled = 1071, IO request blocks = 29 Reads = 2460, Scatter Reads = 2372, Writes = 31, Gather Writes = 3238, Total IO Time (ms) = 422837 DRIVE LEVEL: Sector size = 512, Cylinders = 5221, Media type = 0, Sectors per track = 12, Tracks per Cylinders = 63 DRIVE LEVEL: Read cache enabled = No, Write cache enabled = No DRIVE LEVEL: Read count = 4832, Read time = 20463, Write count = 8953, Write time = 428171, Idle time = 168697, Bytes read = 809762816, Bytes written = 1140978176, Split IO Count = 0, Storage number = 2, Storage manager name = VOLMGR Closing file F:\sqliosim.ldx |
3. 命令行
命令行一共有6个参数。详细用法见 http://support.microsoft.com/kb/231619
| -cfg file | Override the Sqliosim.cfg.ini default configuration file. The SQLIOSim utility returns an error if the utility cannot find the file. |
| -save file | Save the resulting configuration in the configuration file. You can use this option to create the initial configuration file. |
| -log file | Specify the error log file name and the error log file path. The default file name is Sqliosim.log.xml. |
| -dir dir | Set the location to create the data (.mdf) file and the log (.ldf) file. You can run this command multiple times. In most cases, this location is a drive root or a volume mount point. This location can be a long path or a UNC path. |
| -d seconds | Set the duration of the main run. This value excludes the preparation phase and the verification phase. |
| -size MB | Set the initial size of the data file in megabytes (MB). The file can grow up to two times the initial size. The size of the log file is calculated as half the size of the data file. However, the log file cannot be larger than 50 MB. |
三、IOMeter
这是一个第三方的工具,详情请见 http://www.iometer.org/
本文结语:
通过一些磁盘压力测试工具,测试磁盘的性能。
免责声明:本站发布的内容(图片、视频和文字)以原创、转载和分享为主,文章观点不代表本网站立场,如果涉及侵权请联系站长邮箱:is@yisu.com进行举报,并提供相关证据,一经查实,将立刻删除涉嫌侵权内容。


