这篇文章给大家分享的是有关基于python-pptx库中文文档的使用示例的内容。小编觉得挺实用的,因此分享给大家做个参考,一起跟随小编过来看看吧。
一:基础应用
1.创建pptx文档类并插入一页幻灯片
from pptx import Presentation
prs = Presentation()
slide = prs.slides.add_slide(prs.slide_layouts[1])
# 对ppt的修改
prs.save('python-pptx.pptx')
prs.slide_layouts中一共预存有1-48种,采用第六种为空白幻灯片
例slide_layouts[1]为带标题和正文框的ppt,slide_layouts[6]为空白页ppt
slide 及为一页‘幻灯片类'
修改完后 prs.save('name.pptx') 保存ppt
2.在创建的这页幻灯片文本框中添加文字
body_shape = slide.shapes.placeholders # body_shape为本页ppt中所有shapes
body_shape[0].text = 'this is placeholders[0]' # 在第一个文本框中文字框架内添加文字
body_shape[1].text = 'this is placeholders[1]' # 在第二个文本框中文字框架内添加文字
在ppt中所有的元素均被当成一个shape,slide.shapes表示幻灯片类中的模型类,placeholders中为每个模型,采用slide_layouts[1]中包含两个文本框,所以print len(slide.shapes.placeholders) 话为 2。
或
title_shape = slide.shapes.title # 取本页ppt的title
title_shape.text = 'this is a title' # 向title文本框写如文字
subtitle = slide.shapes.placeholders[1] # 取出本页第二个文本框
subtitle.text = 'this is a subtitle' # 在第二个文本框中写入文字
由于采用的slide_layouts[1]包含一个标题和一个正文框,所以可以直接取slide.shapes.title 表示标题框写入文字亦可
3.在文本框中添加新段落
from pptx.util import Pt
new_paragraph = body_shape[1].text_frame.add_paragraph() # 在第二个shape中的文本框架中添加新段落
new_paragraph.text = 'add_paragraph' # 新段落中文字
new_paragraph.font.bold = True # 文字加粗
new_paragraph.font.italic = True # 文字斜体
new_paragraph.font.size = Pt(15) # 文字大小
new_paragraph.font.underline = True # 文字下划线
new_paragraph.level = 1 # 新段落的级别
add_paragraph中的文字支持修改font
pptx.util 中为Pt为文字大小设置
4.添加新文本框
left = top = width = height = Inches(5) # 预设位置及大小
textbox = slide.shapes.add_textbox(left, top, width, height) # left,top为相对位置,width,height为文本框大小
textbox.text = 'this is a new textbox' # 文本框中文字
new_para = textbox.text_frame.add_paragraph() # 在新文本框中添加段落
new_para.text = 'this is second para in textbox' # 段落文字
5.添加图片
img_path = 'img_path.jpg' # 文件路径
left, top, width, height = Inches(1), Inches(4.5), Inches(2), Inches(2) # 预设位置及大小
pic = slide.shapes.add_picture(img_path, left, top, width, height) # 在指定位置按预设值添加图片
6.添加形状
from pptx.enum.shapes import MSO_SHAPE
left, top, width, height = Inches(1), Inches(3), Inches(1.8), Inches(1) # 预设位置及大小
shape = slide.shapes.add_shape(MSO_SHAPE.PENTAGON, left, top, width, height) # 在指定位置按预设值添加类型为PENTAGON的形状
shape.text = 'Step 1'
for n in range(2, 6):
  left = left + width - Inches(0.3)
  shape = slide.shapes.add_shape(MSO_SHAPE.CHEVRON, left, top, width, height)
  shape.text = 'Step{}'.format(n)
MSO_SHAPE中有office中各类型形状,详见:https://msdn.microsoft.com/en-us/library/office/ff862770(v=office.15).aspx
7.添加表格
rows, cols, left, top, width, height = 2, 2, Inches(3.5), Inches(4.5), Inches(6), Inches(0.8)
table = slide.shapes.add_table(rows, cols, left, top, width, height).table # 添加表格,并取表格类
table.columns[0].width = Inches(2.0) # 第一纵列宽度
table.columns[1].width = Inches(4.0) # 第二纵列宽度
table.cell(0, 0).text = 'text00' # 指定位置写入文本
table.cell(0, 1).text = 'text01'
table.cell(1, 0).text = 'text10'
table.cell(1, 1).text = 'text11'
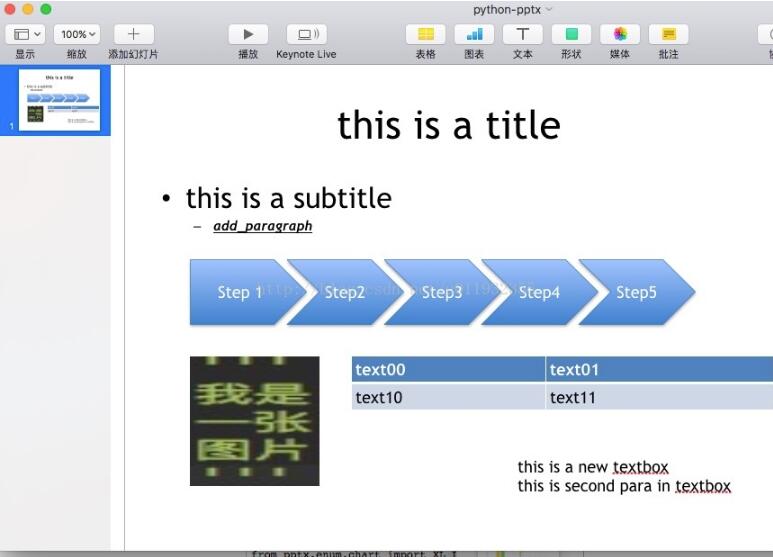
8.demo
根据以上代码生成的一页幻灯片如下:
二:chart类
#!/usr/bin/env python
# encoding: utf-8
from pptx import Presentation
from pptx.chart.data import ChartData
from pptx.enum.chart import XL_CHART_TYPE
from pptx.util import Inches
from pptx.enum.chart import XL_TICK_MARK
from pptx.util import Pt
from pptx.dml.color import RGBColor
from pptx.enum.chart import XL_LABEL_POSITION
from pptx.enum.chart import XL_LEGEND_POSITION
prs = Presentation()
slide = prs.slides.add_slide(prs.slide_layouts[6]) # 在幻灯片中加入一页6号风格(空白)幻灯片
# chart1 左上方图
x, y, cx, cy = Inches(0.5), Inches(0.5), Inches(4), Inches(3) # 按英尺标准指定x,y值
chart_data = ChartData() # 图表data类
chart_data.categories = [u'A班级得分率', u'B班级得分率'] # 图表加入两栏
chart_data.add_series(u'得分率对比', (80.5, 60.5)) # 在两栏分别填入数据
graphic_frame = slide.shapes.add_chart(
XL_CHART_TYPE.COLUMN_CLUSTERED, x, y, cx, cy, chart_data
) # add_chart(图表类型,xy表示图表位置,cx cy表示图表宽高,并且插入chart_data中规定好的数据)
chart = graphic_frame.chart # 从生成的图表中取出图表类
chart.chart_style = 21 # 图表整体颜色风格
chart.has_title = True # 图表是否含有标题,默认为False
chart.chart_title.text_frame.clear() # 清除原标题
new_paragraph = chart.chart_title.text_frame.add_paragraph() # 添加一行新标题
new_paragraph.text = '得分率对比' # 新标题
new_paragraph.font.size = Pt(15) # 新标题字体大小
category_axis = chart.category_axis # category_axis 为chart的category控制类
category_axis.has_major_gridlines = True # 是否显示纵轴线
category_axis.tick_labels.font.italic = True # tick_labels为图表下标签,置为斜体
category_axis.tick_labels.font.size = Pt(15) # 下标签字体大小
category_axis.tick_labels.font.color.rgb = RGBColor(255, 0, 0) # 标签字体颜色
value_axis = chart.value_axis # value_axis 为chart的value控制类
value_axis.maximum_scale = 100.0 # 纵坐标最大值
value_axis.minimum_scale = 0.0 # 纵坐标最小值
value_axis.minor_tick_mark = XL_TICK_MARK.CROSS
value_axis.has_minor_gridlines = True
tick_labels = value_axis.tick_labels # tick_labels 为chart的纵轴标签控制类
tick_labels.number_format = '0%' # 标签显示样式
tick_labels.font.bold = True # 字体加粗
tick_labels.font.size = Pt(14) # 字体大小
tick_labels.font.color.rgb = RGBColor(0, 255, 0) # 标签颜色
plot = chart.plots[0] # 取图表中第一个plot
plot.has_data_labels = True # 是否显示数据标签
data_labels = plot.data_labels # 数据标签控制类
data_labels.font.size = Pt(13) # 字体大小
data_labels.font.color.rgb = RGBColor(0, 0, 255) # 字体颜色
data_labels.position = XL_LABEL_POSITION.INSIDE_END # 字体位置
# chart 2 左下方图
x, y, cx, cy = Inches(0.5), Inches(3.5), Inches(4), Inches(3) # 按英尺标准指定x,y值
chart_data = ChartData()
chart_data.categories = ['A', 'B', 'C', 'D']
chart_data.add_series(u'A班级选项占比', (80, 10, 9, 10))
chart = slide.shapes.add_chart(
XL_CHART_TYPE.PIE, x, y, cx, cy, chart_data
).chart # PIE为饼状图
chart.has_legend = True # 是否含有下方的说明
chart.legend.position = XL_LEGEND_POSITION.BOTTOM
chart.legend.horz_offset = 0 # 说明位移量 [-1, 1] 默认为0
chart.plots[0].has_data_labels = True # 饼中是否写入数值
data_labels = chart.plots[0].data_labels
data_labels.number_format = '0%' # 数值显示格式
data_labels.position = XL_LABEL_POSITION.INSIDE_END # 数值布局方式
chart.has_title = True
chart.chart_title.text_frame.clear() # 清除原标题
new_paragraph = chart.chart_title.text_frame.add_paragraph() # 添加一行新标题
new_paragraph.text = 'A班级选项占比' # 新标题
new_paragraph.font.size = Pt(13) # 新标题字体大小
# chart 3 右下方图
x, y, cx, cy = Inches(5.5), Inches(4), Inches(4), Inches(3) # 按英尺标准指定x,y值
chart_data = ChartData()
chart_data.categories = ['A', 'B', 'C', 'D']
chart_data.add_series(u'B班级选项占比', (0.1, 0.2, 0.3, 0.4))
chart = slide.shapes.add_chart(
XL_CHART_TYPE.PIE, x, y, cx, cy, chart_data
).chart
chart.has_legend = True
chart.legend.position = XL_LEGEND_POSITION.BOTTOM
chart.plots[0].has_data_labels = True
data_labels = chart.plots[0].data_labels
data_labels.number_format = '0%'
data_labels.position = XL_LABEL_POSITION.INSIDE_END
chart.has_title = True
chart.chart_title.text_frame.clear() # 清除原标题
new_paragraph = chart.chart_title.text_frame.add_paragraph() # 添加一行新标题
new_paragraph.text = 'B班级选项占比' # 新标题
new_paragraph.font.size = Pt(13) # 新标题字体大小
# chart 4 右上方图
x, y, cx, cy = Inches(5.5), Inches(0.5), Inches(4), Inches(3)
chart_data = ChartData()
chart_data.categories = ['0', '1-3', '4-6', '7-9']
chart_data.add_series('', (50, 18, 30, 34))
chart = slide.shapes.add_chart(
XL_CHART_TYPE.PIE, x, y, cx, cy, chart_data
).chart
chart.has_legend = True
chart.legend.position = XL_LEGEND_POSITION.BOTTOM
chart.legend.font.size = Pt(13)
chart.plots[0].has_data_labels = True
data_labels = chart.plots[0].data_labels
data_labels.number_format = '0%'
data_labels.position = XL_LABEL_POSITION.INSIDE_END
chart.has_title = True
chart.chart_title.text_frame.clear()
new_title = chart.chart_title.text_frame.add_paragraph()
new_title.text = '得分占比'
new_title.font.size = Pt(13)
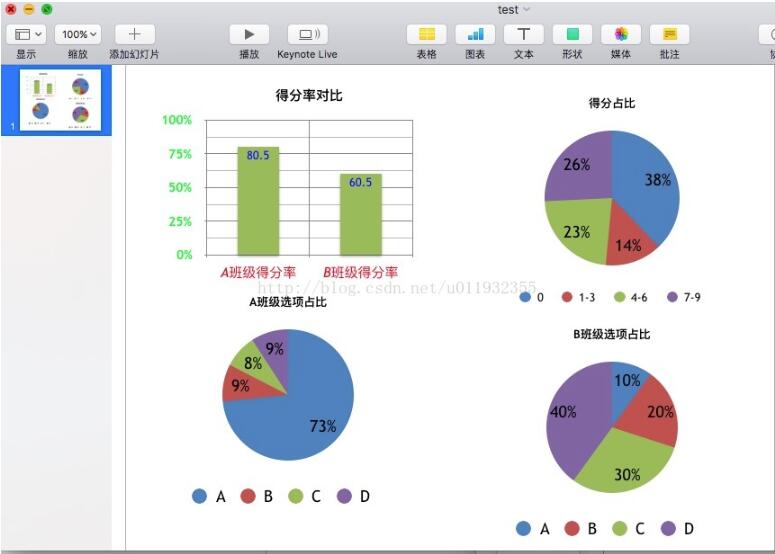
prs.save('test.pptx')生成demo:
感谢各位的阅读!关于“基于python-pptx库中文文档的使用示例”这篇文章就分享到这里了,希望以上内容可以对大家有一定的帮助,让大家可以学到更多知识,如果觉得文章不错,可以把它分享出去让更多的人看到吧!
免责声明:本站发布的内容(图片、视频和文字)以原创、转载和分享为主,文章观点不代表本网站立场,如果涉及侵权请联系站长邮箱:is@yisu.com进行举报,并提供相关证据,一经查实,将立刻删除涉嫌侵权内容。


