еҰӮдҪ•еңЁpythonдёӯдҪҝз”ЁsubplotеҮҪж•°
иҝҷжңҹеҶ…е®№еҪ“дёӯе°Ҹзј–е°Ҷдјҡз»ҷеӨ§е®¶еёҰжқҘжңүе…іеҰӮдҪ•еңЁpythonдёӯдҪҝз”ЁsubplotеҮҪж•°пјҢж–Үз« еҶ…е®№дё°еҜҢдё”д»Ҙдё“дёҡзҡ„и§’еәҰдёәеӨ§е®¶еҲҶжһҗе’ҢеҸҷиҝ°пјҢйҳ…иҜ»е®ҢиҝҷзҜҮж–Үз« еёҢжңӣеӨ§е®¶еҸҜд»ҘжңүжүҖ收иҺ·гҖӮ
дёҖгҖҒдҪңеӣҫжөҒзЁӢпјҡ
1.еҮҶеӨҮж•°жҚ®пјҢ пјҢ 3дҪңеӣҫпјҢ 4е®ҡеҲ¶пјҢ 5дҝқеӯҳпјҢ 6жҳҫзӨә
1.ж•°жҚ®еҸҜд»ҘжҳҜnumpyж•°з»„пјҢд№ҹеҸҜд»ҘжҳҜlist
2еҲӣе»әз”»еёғпјҡ
import matplotlib.pyplot as plt
#figure(num=None, figsize=None, dpi=None, facecolor=None, edgecolor=None, frameon=True)
#num:еӣҫеғҸзј–еҸ·жҲ–еҗҚз§°пјҢж•°еӯ—дёәзј–еҸ· пјҢеӯ—з¬ҰдёІдёәеҗҚз§°
#figsize:жҢҮе®ҡfigureзҡ„е®Ҫе’Ңй«ҳпјҢеҚ•дҪҚдёәиӢұеҜёпјӣ
#dpiеҸӮж•°жҢҮе®ҡз»ҳеӣҫеҜ№иұЎзҡ„еҲҶиҫЁзҺҮпјҢеҚіжҜҸиӢұеҜёеӨҡе°‘дёӘеғҸзҙ пјҢзјәзңҒеҖјдёә80 ,1иӢұеҜёзӯүдәҺ2.5cm,A4зәёжҳҜ 21*30cmзҡ„зәёеј
#facecolor:иғҢжҷҜйўңиүІ
#edgecolor:иҫ№жЎҶйўңиүІ
#frameon:жҳҜеҗҰжҳҫзӨәиҫ№
fig = plt.figure()
fig = plt.figure(figsize=(8,6), dpi=80)
fig.add_axes()
fig, axes = plt.subplos(nrows = 2, ncols = 2) #axesжҳҜй•ҝеәҰдёә4зҡ„еҲ—иЎЁ
3гҖҒдҪңеӣҫи·Ҝзәҝ
дёҖз»ҙж•°жҚ®пјҡ
axes[0, 0].plot(x, y)
axes[0,1].bar([1,2,3], [2,4,8])
axes[0,2].barh([1,2,3], [2,4,8])
axes[1,0].axhline(0.45)
axes[1, 1].scatter(x, y)
axes[1,2].axvline(0.65)
axes[2,0].fill(x,y, color = 'blue')
axes[2,1].fill_between(x,y, color = 'blue')
axes[2,2].violinplot(y)
axes[0,3].arrow(0,0,0.5,0.5)
axes[1,3].quiver(x,y)
4, е®ҡеҲ¶
plt.plot(x,y, alpha=0.4, c = 'blue', maker = 'o')
#йўңиүІпјҢж Үи®°пјҢйҖҸжҳҺеәҰ
# жҳҫзӨәж•°еӯҰж–Үжң¬
t = np.arange(0.0, 2.0, 0.01)
s = np.sin(2*np.pi*t)
plt.plot(t,s)
plt.title(r'$\alpha_i > \beta_i$', fontsize=20)
plt.text(1, -0.6, r'$\sum_{i=0}^\infty x_i$', fontsize=20)
plt.text(0.6, 0.6, r'$\mathcal{A}\mathrm{sin}(2 \omega t)$',
fontsize=20)
plt.xlabel('time (s)')
plt.ylabel('volts (mV)')
fig = plt.figure()
fig.suptitle('bold figure suptitle', fontsize=14, fontweight='bold')
ax = fig.add_subplot(111)
fig.subplots_adjust(top=0.85)
ax.set_title('axes title')
ax.set_xlabel('xlabel')
ax.set_ylabel('ylabel')
ax.text(3, 8, 'boxed italics text in data coords', style='italic',
bbox={'facecolor':'red', 'alpha':0.5, 'pad':10})
ax.text(2, 6, r'an equation: $E=mc^2$', fontsize=15)
ax.text(3, 2, u'unicode: Institut f\374r Festk\366rperphysik')
ax.text(0.95, 0.01, 'colored text in axes coords',
verticalalignment='bottom', horizontalalignment='right',
transform=ax.transAxes,
color='green', fontsize=15)
ax.plot([2], [1], 'o')
# жіЁйҮҠ
ax.annotate('жҲ‘жҳҜжіЁйҮҠе•Ұ', xy=(2, 1), xytext=(3, 4),color='r',size=15,
arrowprops=dict(facecolor='g', shrink=0.05))
ax.axis([0, 10, 0, 10])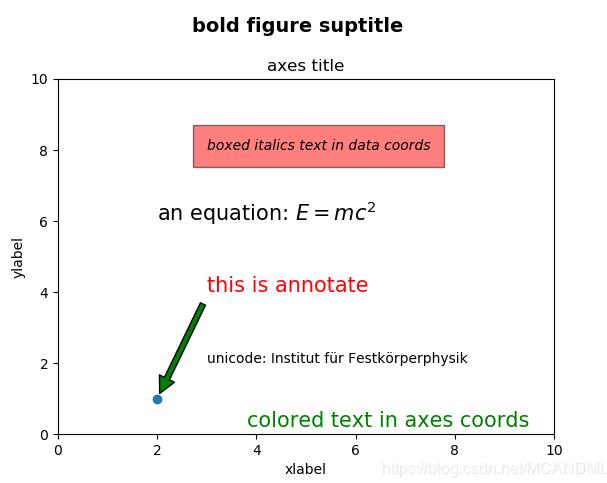
5, дҝқеӯҳжҳҫзӨә
plt.savefig("1.png")
plt.savefig("1.png", trainsparent =True)
plt.show()дәҢгҖҒйғЁеҲҶеҮҪж•°дҪҝз”ЁиҜҰи§Јпјҡ
1, fig.add_subplot(numrows, numcols, fignum) ####дёүдёӘеҸӮж•°пјҢеҲҶеҲ«д»ЈиЎЁеӯҗеӣҫзҡ„иЎҢж•°пјҢеҲ—ж•°пјҢеӣҫзҙўеј•еҸ·гҖӮ eg: ax = fig.add_subplot(2, 3, 1) (or ,ax = fig.add_subplot(231))
2, plt.subplots()дҪҝз”Ё
x = np.linspace(0, 2*np.pi,400)
y = np.sin(x**2)
fig, ax = plt.subplots()
ax.plot(x, y)
ax.set_title('Simple plot')
# Creates two subplots and unpacks the output array immediately
#fig = plt.figure(figsize=(6,6))
f, (ax1, ax2) = plt.subplots(1, 2, sharey=True)
ax1.plot(x, y)
ax1.set_title('Sharing Y axis')
ax2.scatter(x, y)
# Creates four polar axes, and accesses them through the returned array
fig, axes = plt.subplots(2, 2, subplot_kw=dict(polar=True))
axes[0, 0].plot(x, y)
axes[1, 1].scatter(x, y)
# Share a X axis with each column of subplots
plt.subplots(2, 2, sharex='col')
# Share a Y axis with each row of subplots
plt.subplots(2, 2, sharey='row')
# Share both X and Y axes with all subplots
plt.subplots(2, 2, sharex='all', sharey='all')
# Note that this is the same as
plt.subplots(2, 2, sharex=True, sharey=True)
# Creates figure number 10 with a single subplot
# and clears it if it already exists.
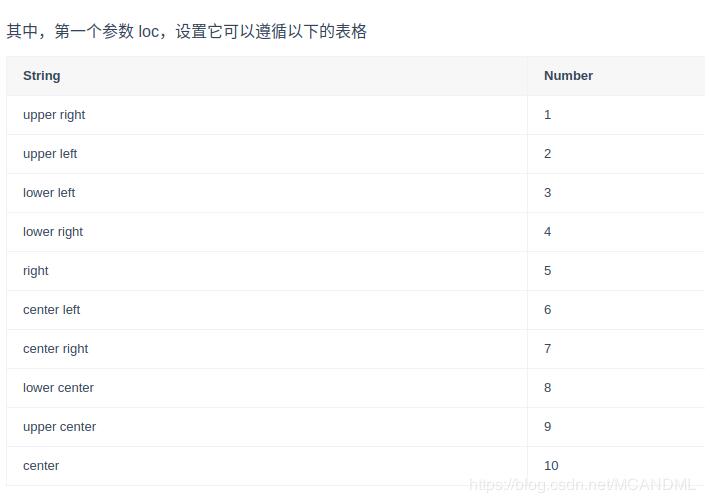
fig, ax=plt.subplots(num=10, clear=True)3.plt.legend()
plt.legend(loc='String or Number', bbox_to_anchor=(num1, num2))
plt.legend(loc='upper center', bbox_to_anchor (0.6,0.95),ncol=3,fancybox=True,shadow=True)
#bbox_to_anchorиў«иөӢдәҲзҡ„дәҢе…ғз»„дёӯпјҢ第дёҖдёӘж•°еҖјз”ЁдәҺжҺ§еҲ¶legendзҡ„е·ҰеҸіз§»еҠЁпјҢеҖји¶ҠеӨ§и¶Ҡеҗ‘еҸіиҫ№з§»еҠЁпјҢ第дәҢдёӘж•°еҖјз”ЁдәҺжҺ§еҲ¶legendзҡ„дёҠдёӢ移еҠЁпјҢеҖји¶ҠеӨ§пјҢи¶Ҡеҗ‘дёҠ移еҠЁ
pythonдё»иҰҒеә”з”ЁйўҶеҹҹжңүе“Әдәӣ
1гҖҒдә‘и®Ўз®—пјҢе…ёеһӢеә”з”ЁOpenStackгҖӮ2гҖҒWEBеүҚз«ҜејҖеҸ‘пјҢдј—еӨҡеӨ§еһӢзҪ‘з«ҷеқҮдёәPythonејҖеҸ‘гҖӮ3.дәәе·ҘжҷәиғҪеә”з”ЁпјҢеҹәдәҺеӨ§ж•°жҚ®еҲҶжһҗе’Ңж·ұеәҰеӯҰд№ иҖҢеҸ‘еұ•еҮәжқҘзҡ„дәәе·ҘжҷәиғҪжң¬иҙЁдёҠе·Із»Ҹж— жі•зҰ»ејҖpythonгҖӮ4гҖҒзі»з»ҹиҝҗз»ҙе·ҘзЁӢйЎ№зӣ®пјҢиҮӘеҠЁеҢ–иҝҗз»ҙзҡ„ж Үй…Қе°ұжҳҜpython+Django/flaskгҖӮ5гҖҒйҮ‘иһҚзҗҶиҙўеҲҶжһҗпјҢйҮҸеҢ–дәӨжҳ“пјҢйҮ‘иһҚеҲҶжһҗгҖӮ6гҖҒеӨ§ж•°жҚ®еҲҶжһҗгҖӮ
дёҠиҝ°е°ұжҳҜе°Ҹзј–дёәеӨ§е®¶еҲҶдә«зҡ„еҰӮдҪ•еңЁpythonдёӯдҪҝз”ЁsubplotеҮҪж•°дәҶпјҢеҰӮжһңеҲҡеҘҪжңүзұ»дјјзҡ„з–‘жғ‘пјҢдёҚеҰЁеҸӮз…§дёҠиҝ°еҲҶжһҗиҝӣиЎҢзҗҶи§ЈгҖӮеҰӮжһңжғізҹҘйҒ“жӣҙеӨҡзӣёе…ізҹҘиҜҶпјҢж¬ўиҝҺе…іжіЁдәҝйҖҹдә‘иЎҢдёҡиө„и®Ҝйў‘йҒ“гҖӮ


