因为Prometheus是基于GoLang编写,编译后的软件包,不依赖于任何的第三方依赖。用户只需要下载对应平台的二进制包,并解压添加基本配置即可正常启动Prometheus server。
下载页面:https://prometheus.io/download/
我们选择对应的下载版本,这里我们下载的是最新版本2.13.0 linux版本,下载地址为:https://github.com/prometheus/prometheus/releases/download/v2.13.0/prometheus-2.13.0.linux-amd64.tar.gz
我们在服务器上安装部署:
[root@Prometheus ~]# mkdir /usr/local/prometheus
[root@Prometheus ~]# cd /usr/local/prometheus
[root@Prometheus prometheus]# wget  https://github.com/prometheus/prometheus/releases/download/v2.13.0/prometheus-2.13.0.linux-amd64.tar.gz
[root@Prometheus prometheus]# tar xvf prometheus-2.13.0.linux-amd64.tar.gz
prometheus-2.13.0.linux-amd64/
prometheus-2.13.0.linux-amd64/NOTICE
prometheus-2.13.0.linux-amd64/promtool
prometheus-2.13.0.linux-amd64/consoles/
prometheus-2.13.0.linux-amd64/consoles/prometheus.html
prometheus-2.13.0.linux-amd64/consoles/node-overview.html
prometheus-2.13.0.linux-amd64/consoles/node-cpu.html
prometheus-2.13.0.linux-amd64/consoles/node.html
prometheus-2.13.0.linux-amd64/consoles/index.html.example
prometheus-2.13.0.linux-amd64/consoles/prometheus-overview.html
prometheus-2.13.0.linux-amd64/consoles/node-disk.html
prometheus-2.13.0.linux-amd64/LICENSE
prometheus-2.13.0.linux-amd64/console_libraries/
prometheus-2.13.0.linux-amd64/console_libraries/prom.lib
prometheus-2.13.0.linux-amd64/console_libraries/menu.lib
prometheus-2.13.0.linux-amd64/tsdb
prometheus-2.13.0.linux-amd64/prometheus.yml
prometheus-2.13.0.linux-amd64/prometheus解压后同级目录里面会看到prometheus.yml配置文件
# my global config
global:
scrape_interval: 15s #抓去采样数据的时间间隔,默认15s去被监控主机上采取一次
evaluation_interval: 15s # 每15秒评估一次规则。 默认值为每1分钟。 监控数据规则的评估频率(当我们设置硬盘> 80%报警 这条rule规则 那个prometheus会默认没15S来执行这个rule规则检查硬盘使用情况)
# scrape_timeout is set to the global default (10s).
# Alertmanager configuration(如何报警,报警信息)
alerting:
alertmanagers:
- static_configs:
- targets:
# - alertmanager:9093
# Load rules once and periodically evaluate them according to the global 'evaluation_interval'.()
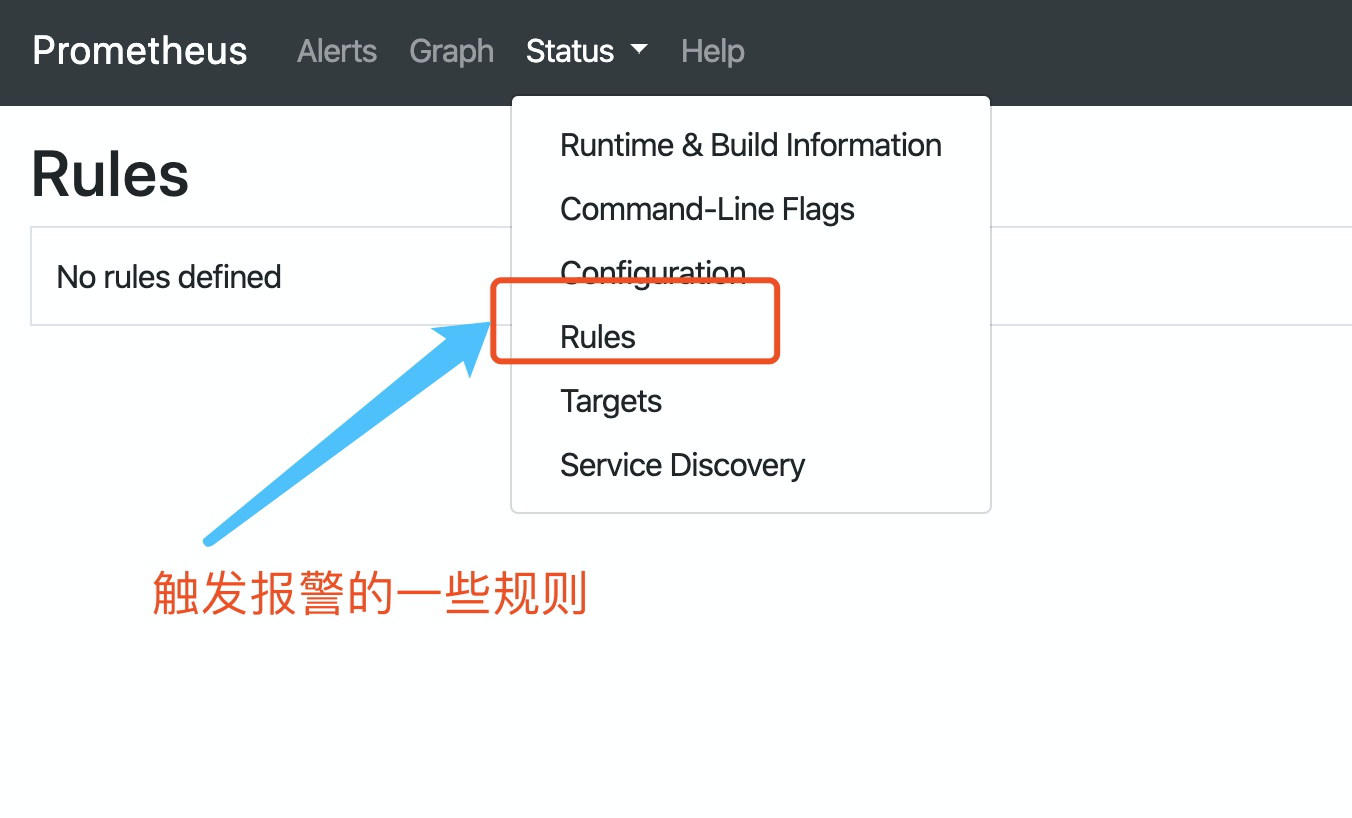
rule_files:
# - "first_rules.yml"
# - "second_rules.yml"
# A scrape configuration containing exactly one endpoint to scrape:
# Here it's Prometheus itself.
scrape_configs:
# The job name is added as a label `job=<job_name>` to any timeseries scraped from this config.
- job_name: 'prometheus'
# metrics_path defaults to '/metrics'
# scheme defaults to 'http'.
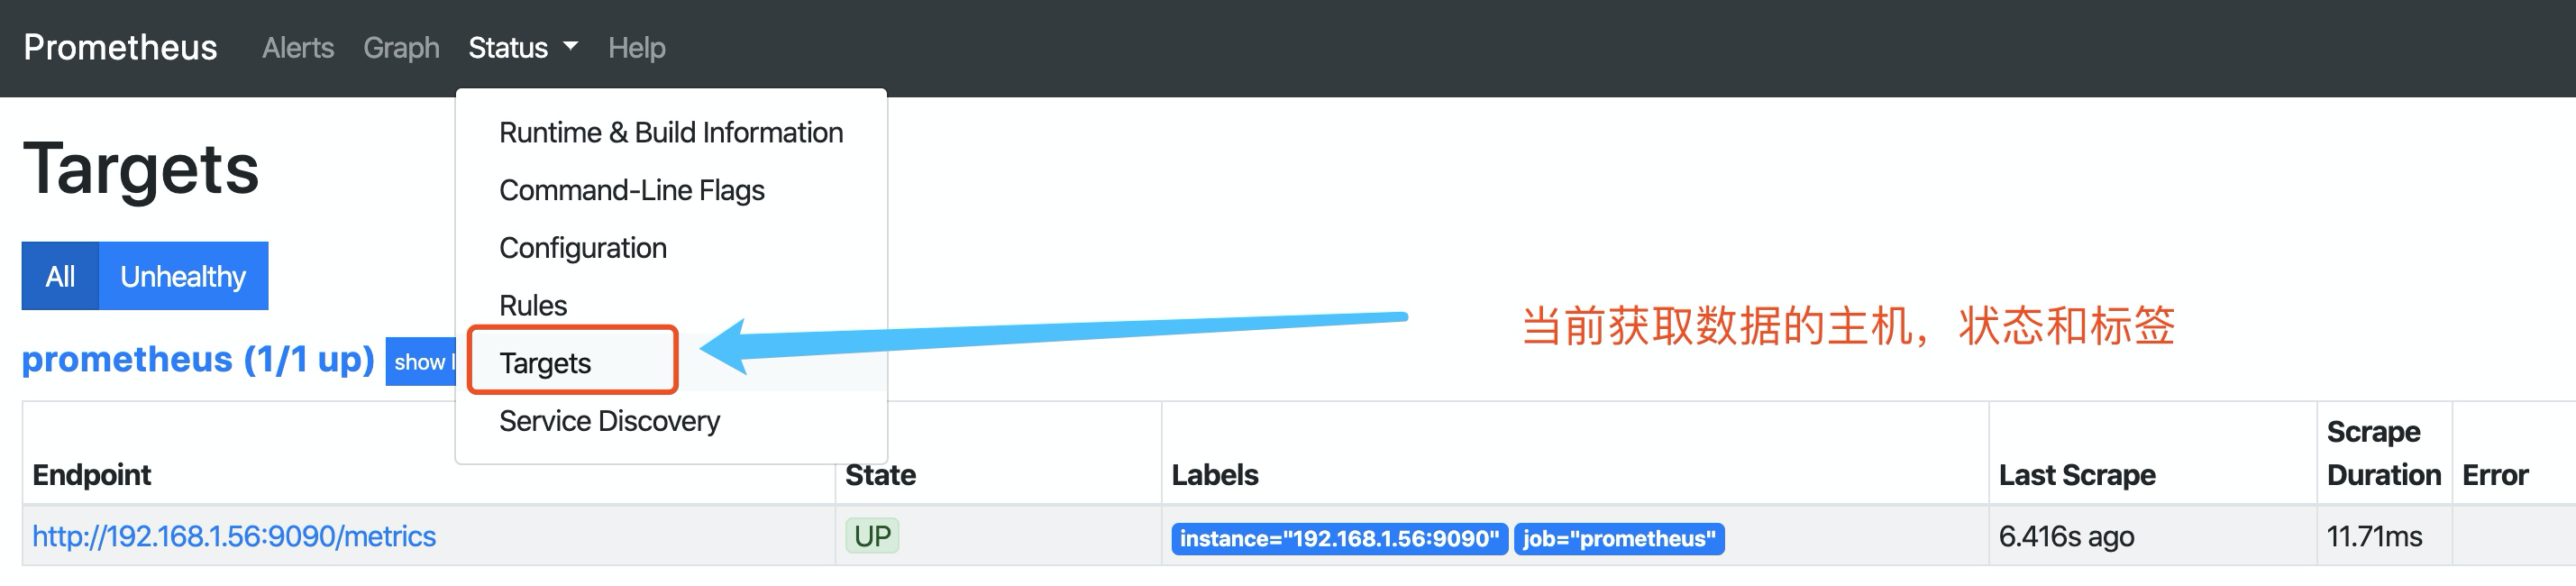
static_configs:
- targets: ['localhost:9090'] #静态配置的监控主机启动prometheus
[root@Prometheus prometheus-2.13.0.linux-amd64]# ./prometheus --config.file=prometheus.yml
level=info ts=2019-10-11T01:53:36.252Z caller=main.go:296 msg="no time or size retention was set so using the default time retention" duration=15d
level=info ts=2019-10-11T01:53:36.252Z caller=main.go:332 msg="Starting Prometheus" version="(version=2.13.0, branch=HEAD, revision=6ea4252299f542669aca11860abc2192bdc7bede)"
level=info ts=2019-10-11T01:53:36.252Z caller=main.go:333 build_context="(go=go1.13.1, user=root@f30bdad2c3fd, date=20191004-11:25:34)"
level=info ts=2019-10-11T01:53:36.252Z caller=main.go:334 host_details="(Linux 3.10.0-957.el7.x86_64 #1 SMP Thu Nov 8 23:39:32 UTC 2018 x86_64 Prometheus (none))"
level=info ts=2019-10-11T01:53:36.252Z caller=main.go:335 fd_limits="(soft=1024, hard=4096)"
level=info ts=2019-10-11T01:53:36.252Z caller=main.go:336 vm_limits="(soft=unlimited, hard=unlimited)"
level=info ts=2019-10-11T01:53:36.254Z caller=main.go:657 msg="Starting TSDB ..."
level=info ts=2019-10-11T01:53:36.256Z caller=web.go:450 component=web msg="Start listening for connections" address=0.0.0.0:9090
level=info ts=2019-10-11T01:53:36.258Z caller=head.go:512 component=tsdb msg="replaying WAL, this may take awhile"
level=info ts=2019-10-11T01:53:36.265Z caller=head.go:560 component=tsdb msg="WAL segment loaded" segment=0 maxSegment=1
level=info ts=2019-10-11T01:53:36.265Z caller=head.go:560 component=tsdb msg="WAL segment loaded" segment=1 maxSegment=1
level=info ts=2019-10-11T01:53:36.267Z caller=main.go:672 fs_type=XFS_SUPER_MAGIC
level=info ts=2019-10-11T01:53:36.267Z caller=main.go:673 msg="TSDB started"
level=info ts=2019-10-11T01:53:36.267Z caller=main.go:743 msg="Loading configuration file" filename=prometheus.yml
level=info ts=2019-10-11T01:53:36.285Z caller=main.go:771 msg="Completed loading of configuration file" filename=prometheus.yml
level=info ts=2019-10-11T01:53:36.285Z caller=main.go:626 msg="Server is ready to receive web requests."
我们直接指定配置文件之后就启动起来了,但是在实际工作中我门不会这样启动,还会加上如下一些配置参数
--config.file="/usr/local/prometheus/prometheus.yml"   #启动的配置文件
--web.listen-address="0.0.0.0:9090"                #监听的地址端口
--web.max-connections=512                          #最大连接数
--storage.tsdb.path="data/"                        #本地存储的位置
--storage.tsdb.retention=15d                       #数据在本地存储的时间
--storage.tsdb.no-lockfile                        #不允许在数据目录里面创建锁文件
--query.timeout=2m                                 #查询超时时间
--query.max-concurrency=20                         #同时查询的并发数
所以在生产中我们一般这样启动prometheus
nohup prometheus --config.file="/usr/local/prometheus/prometheus.yml" --web.listen-address="0.0.0.0:9090" --web.max-connections=512 --storage.tsdb.path="data/" --storage.tsdb.retention=15d --query.timeout=2m --query.max-concurrency=20 &在当前docker这么方便的情况下,我们肯定要来介绍下通过docker是如何来安装部署prometheus;
mkdir /usr/local/prometheus/data
chmod 777 /usr/local/prometheus/data
docker run -id --name prometheus -p 9090:9090 -v /etc/localtime:/etc/localtime:ro -v /usr/local/prometheus/data:/prometheus_data -v /usr/local/prometheus/prometheus-2.13.0.linux-amd64/prometheus.yml:/etc/prometheus/prometheus.yml prom/prometheus --config.file=/etc/prometheus/prometheus.yml --web.listen-address=0.0.0.0:9090 --web.max-connections=512 --storage.tsdb.path=/prometheus_data --storage.tsdb.retention=15d --query.timeout=2m --query.max-concurrency=20这里讲诉一个技巧,当我第一次启动prometheus指定启动的参数的时候一致启动不起来报 找不到指定的配置文件, 我们直接启动的时候他都是能启动的了的,为什么我加上其余的参数之后,就提示这个呢?百思不得其解,知道我看了prometheus镜像的dockerfile的时候,我瞬间明白是为什么了,Prometheus_Dockerfile地址
ARG ARCH="amd64"
ARG OS="linux"
FROM quay.io/prometheus/busybox-${OS}-${ARCH}:latest
LABEL maintainer="The Prometheus Authors <prometheus-developers@googlegroups.com>"

ARG ARCH="amd64"
ARG OS="linux"
COPY .build/${OS}-${ARCH}/prometheus        /bin/prometheus
COPY .build/${OS}-${ARCH}/promtool          /bin/promtool
COPY documentation/examples/prometheus.yml  /etc/prometheus/prometheus.yml
COPY console_libraries/                     /usr/share/prometheus/console_libraries/
COPY consoles/                              /usr/share/prometheus/consoles/

RUN ln -s /usr/share/prometheus/console_libraries /usr/share/prometheus/consoles/ /etc/prometheus/
RUN mkdir -p /prometheus && \
    chown -R nobody:nogroup etc/prometheus /prometheus

USER       nobody
EXPOSE     9090
VOLUME     [ "/prometheus" ]
WORKDIR    /prometheus
ENTRYPOINT [ "/bin/prometheus" ]
CMD        [ "--config.file=/etc/prometheus/prometheus.yml", \
             "--storage.tsdb.path=/prometheus", \
             "--web.console.libraries=/usr/share/prometheus/console_libraries", \
             "--web.console.templates=/usr/share/prometheus/consoles" ]
看到这个dockerfile 前面的我们现在可以不关心他,主要的就是在最后一行CMD,原来是我们在追加参数的时候把CMD的参数给覆盖掉了,所以找不到配置文件的路径,我们这个时候再给他加上就OK了。
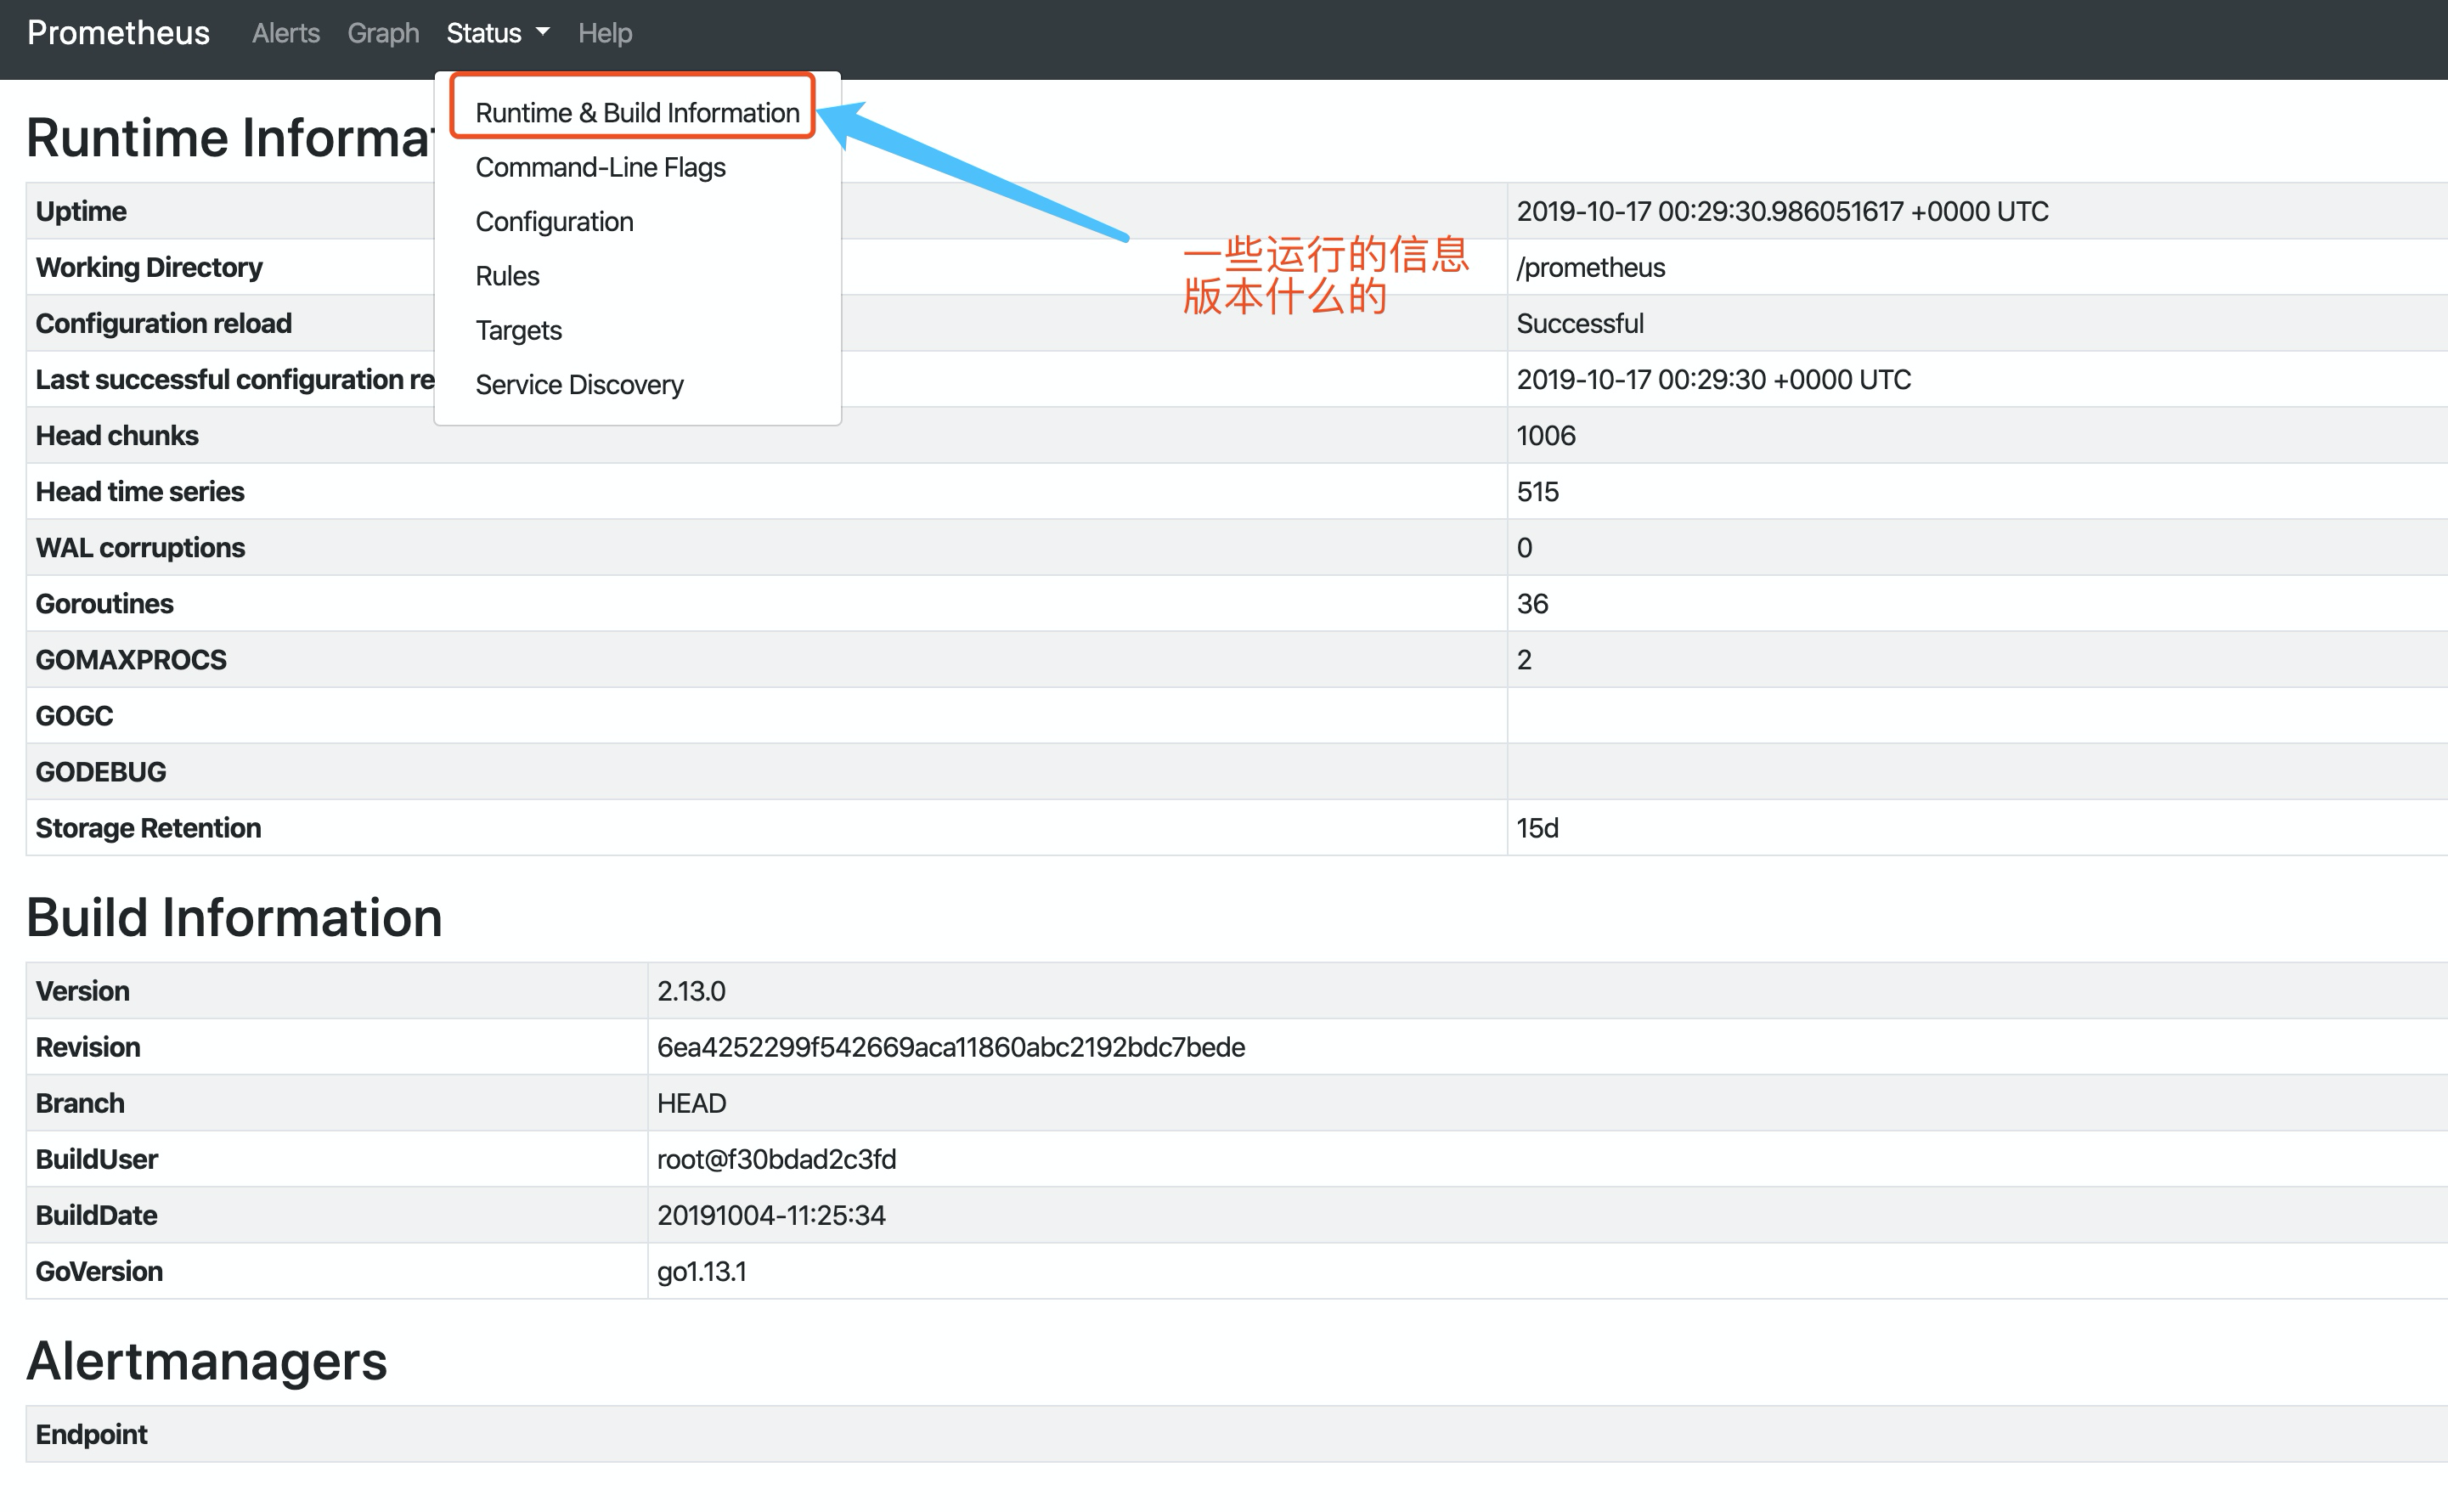
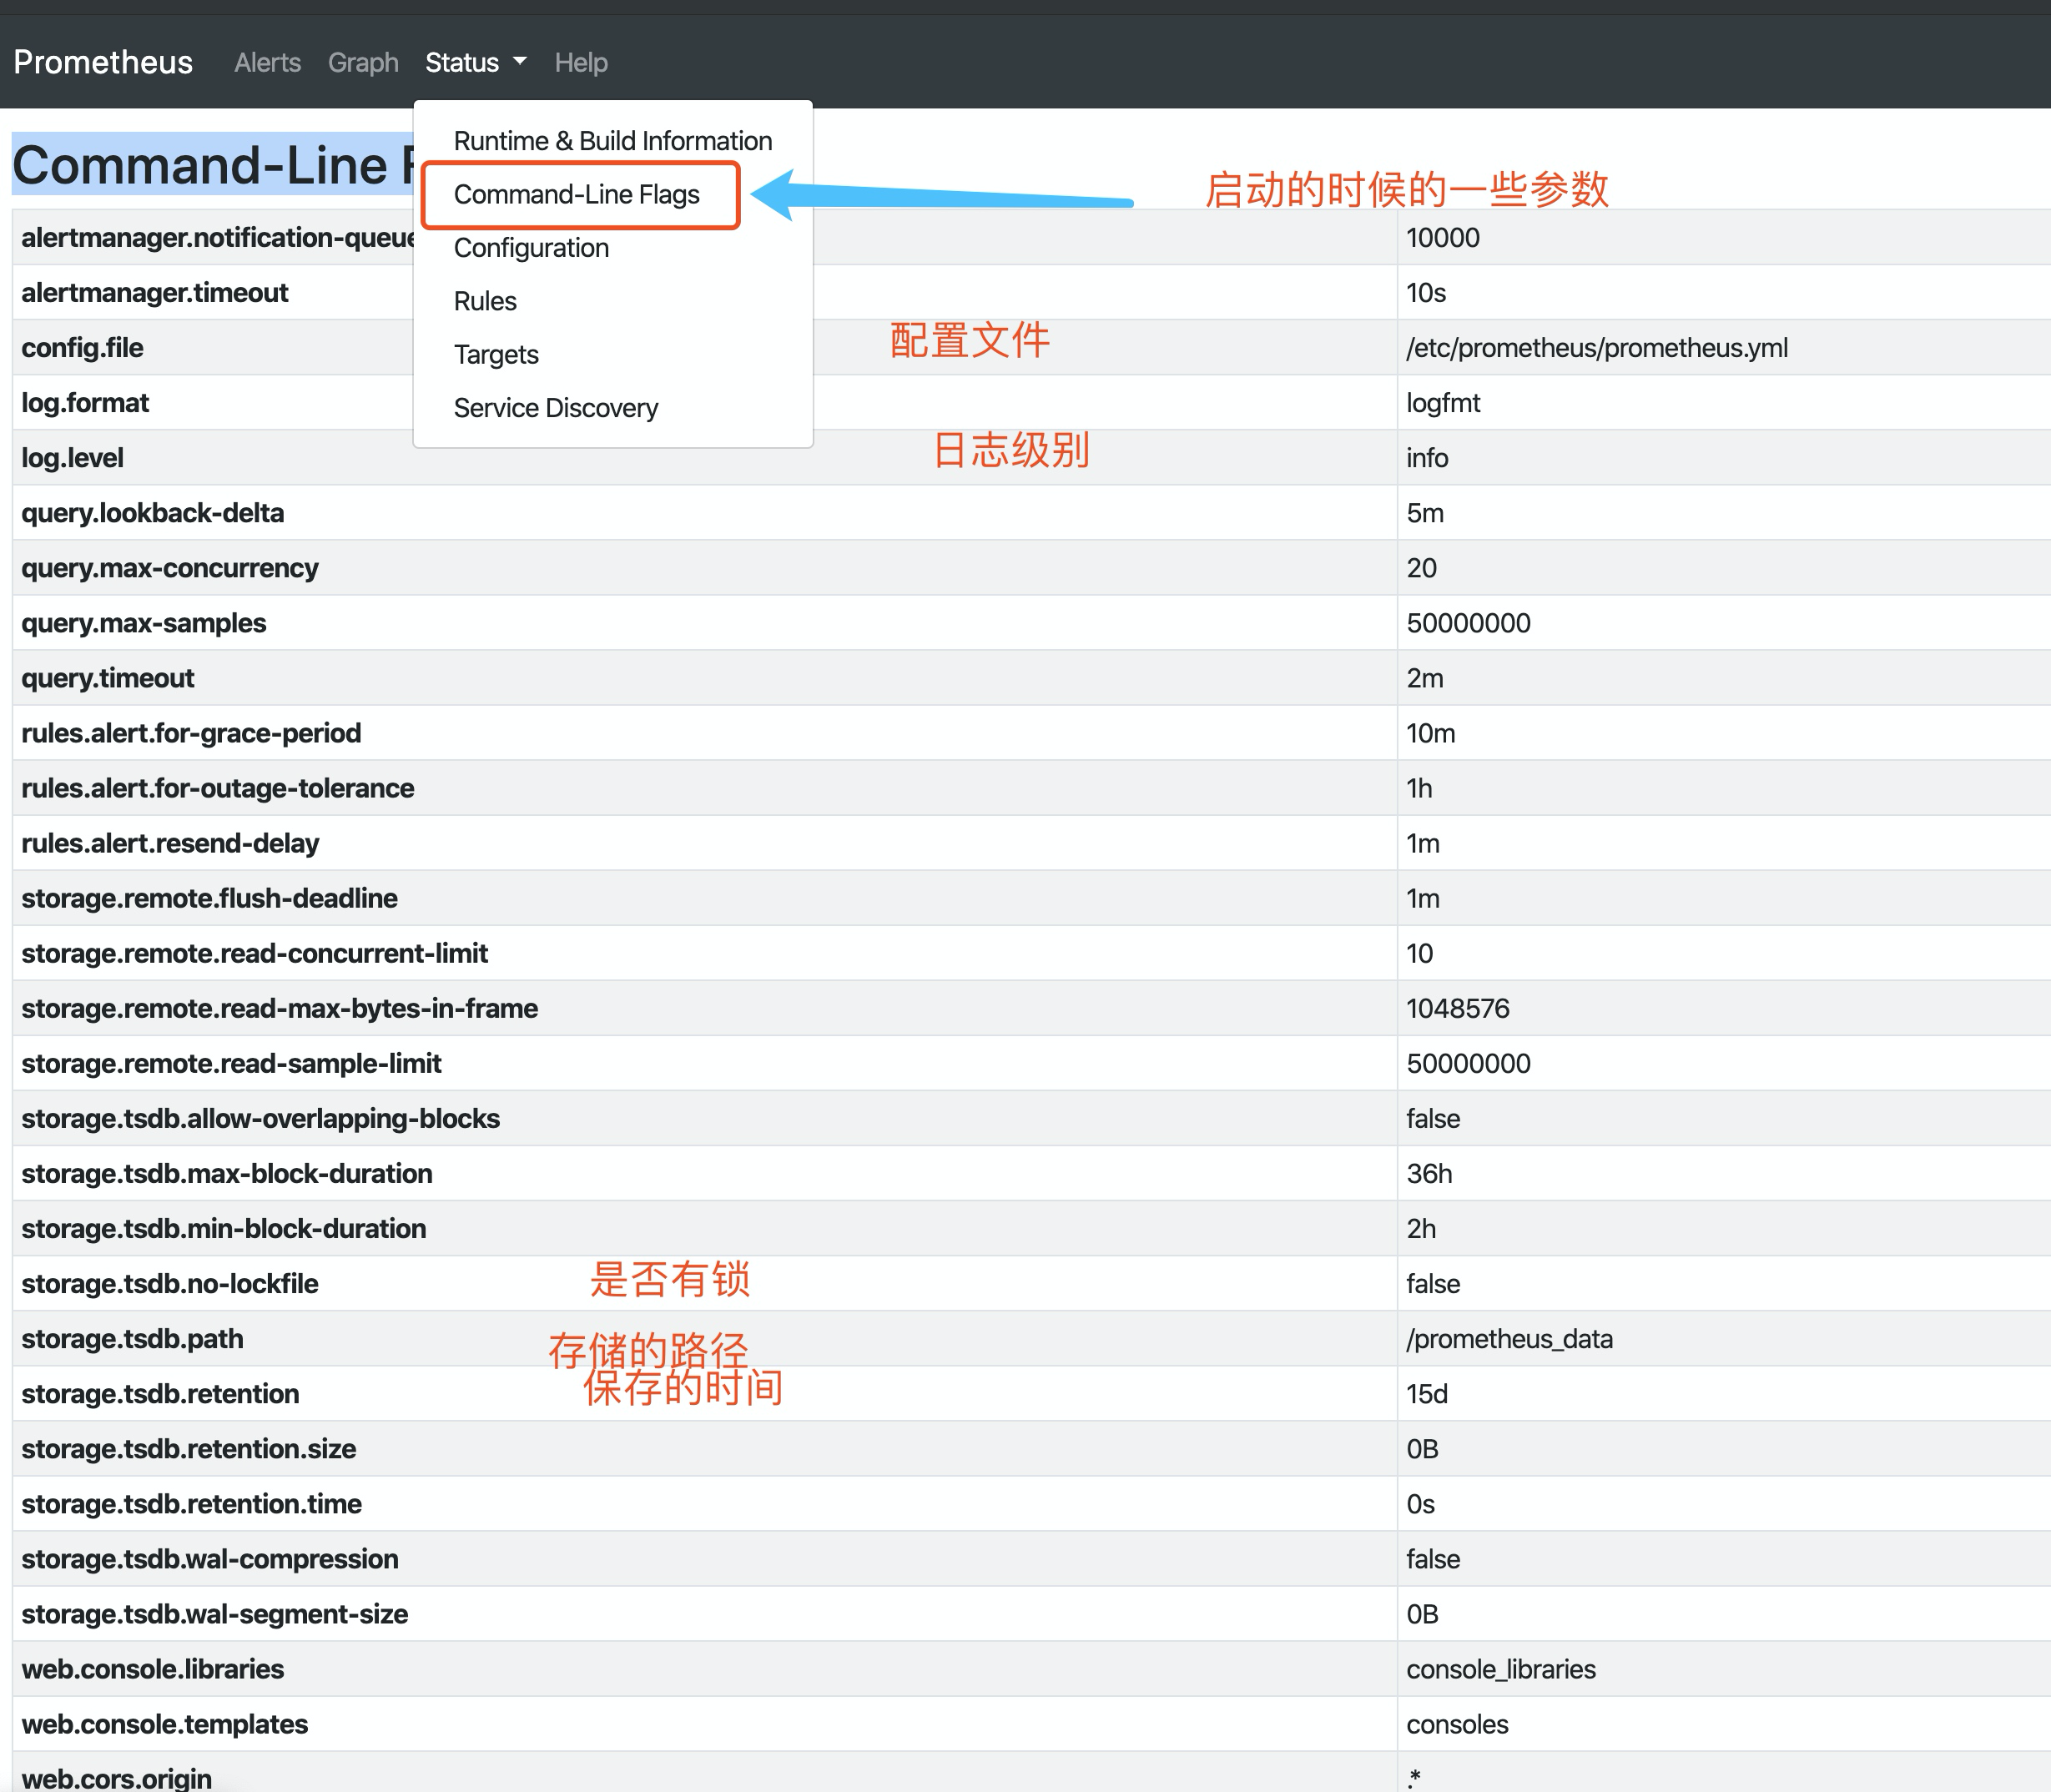
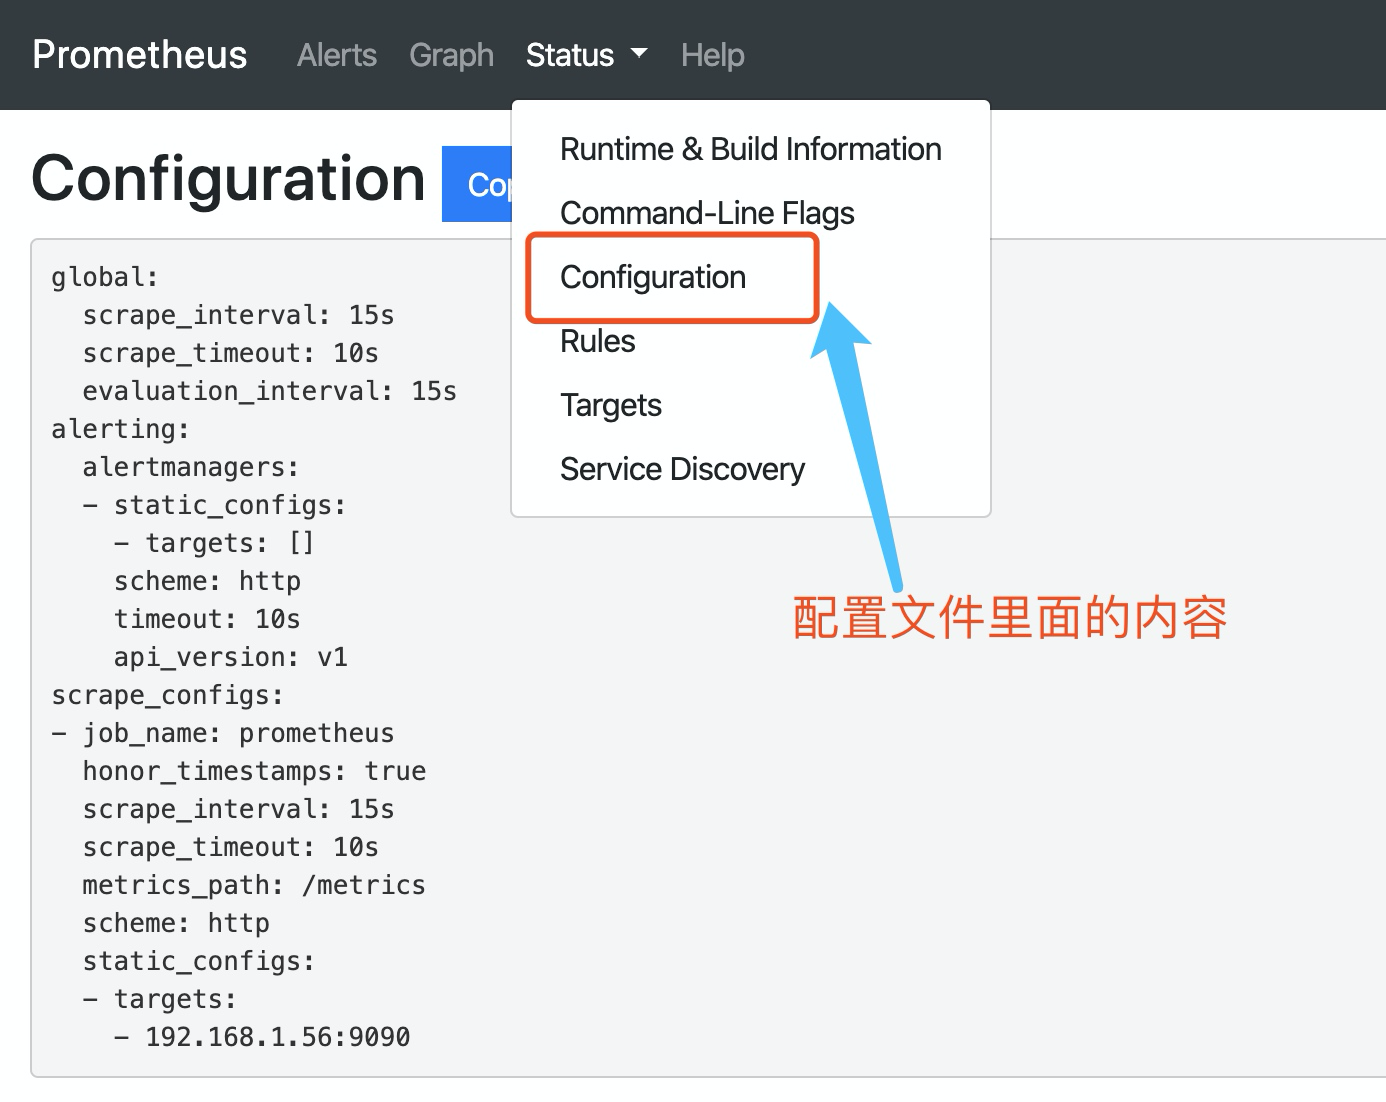
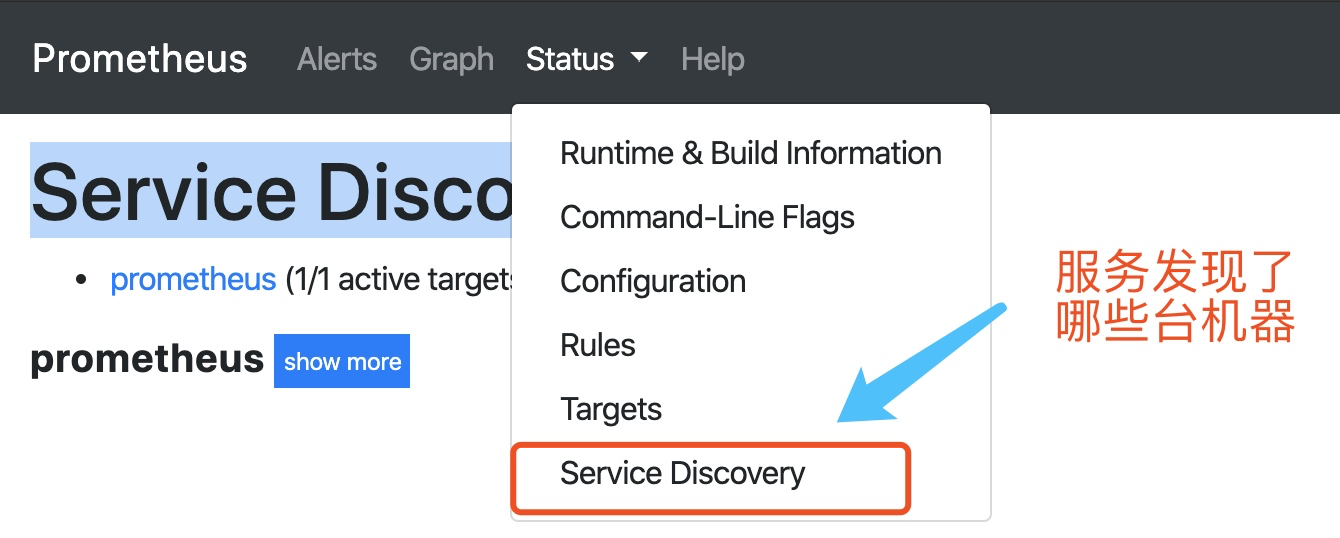
不管我们通过哪种方式来启动的prometheus service端,我们都通过如下的方式登陆prometheus dashboard界面,登陆方式为http://IP:9090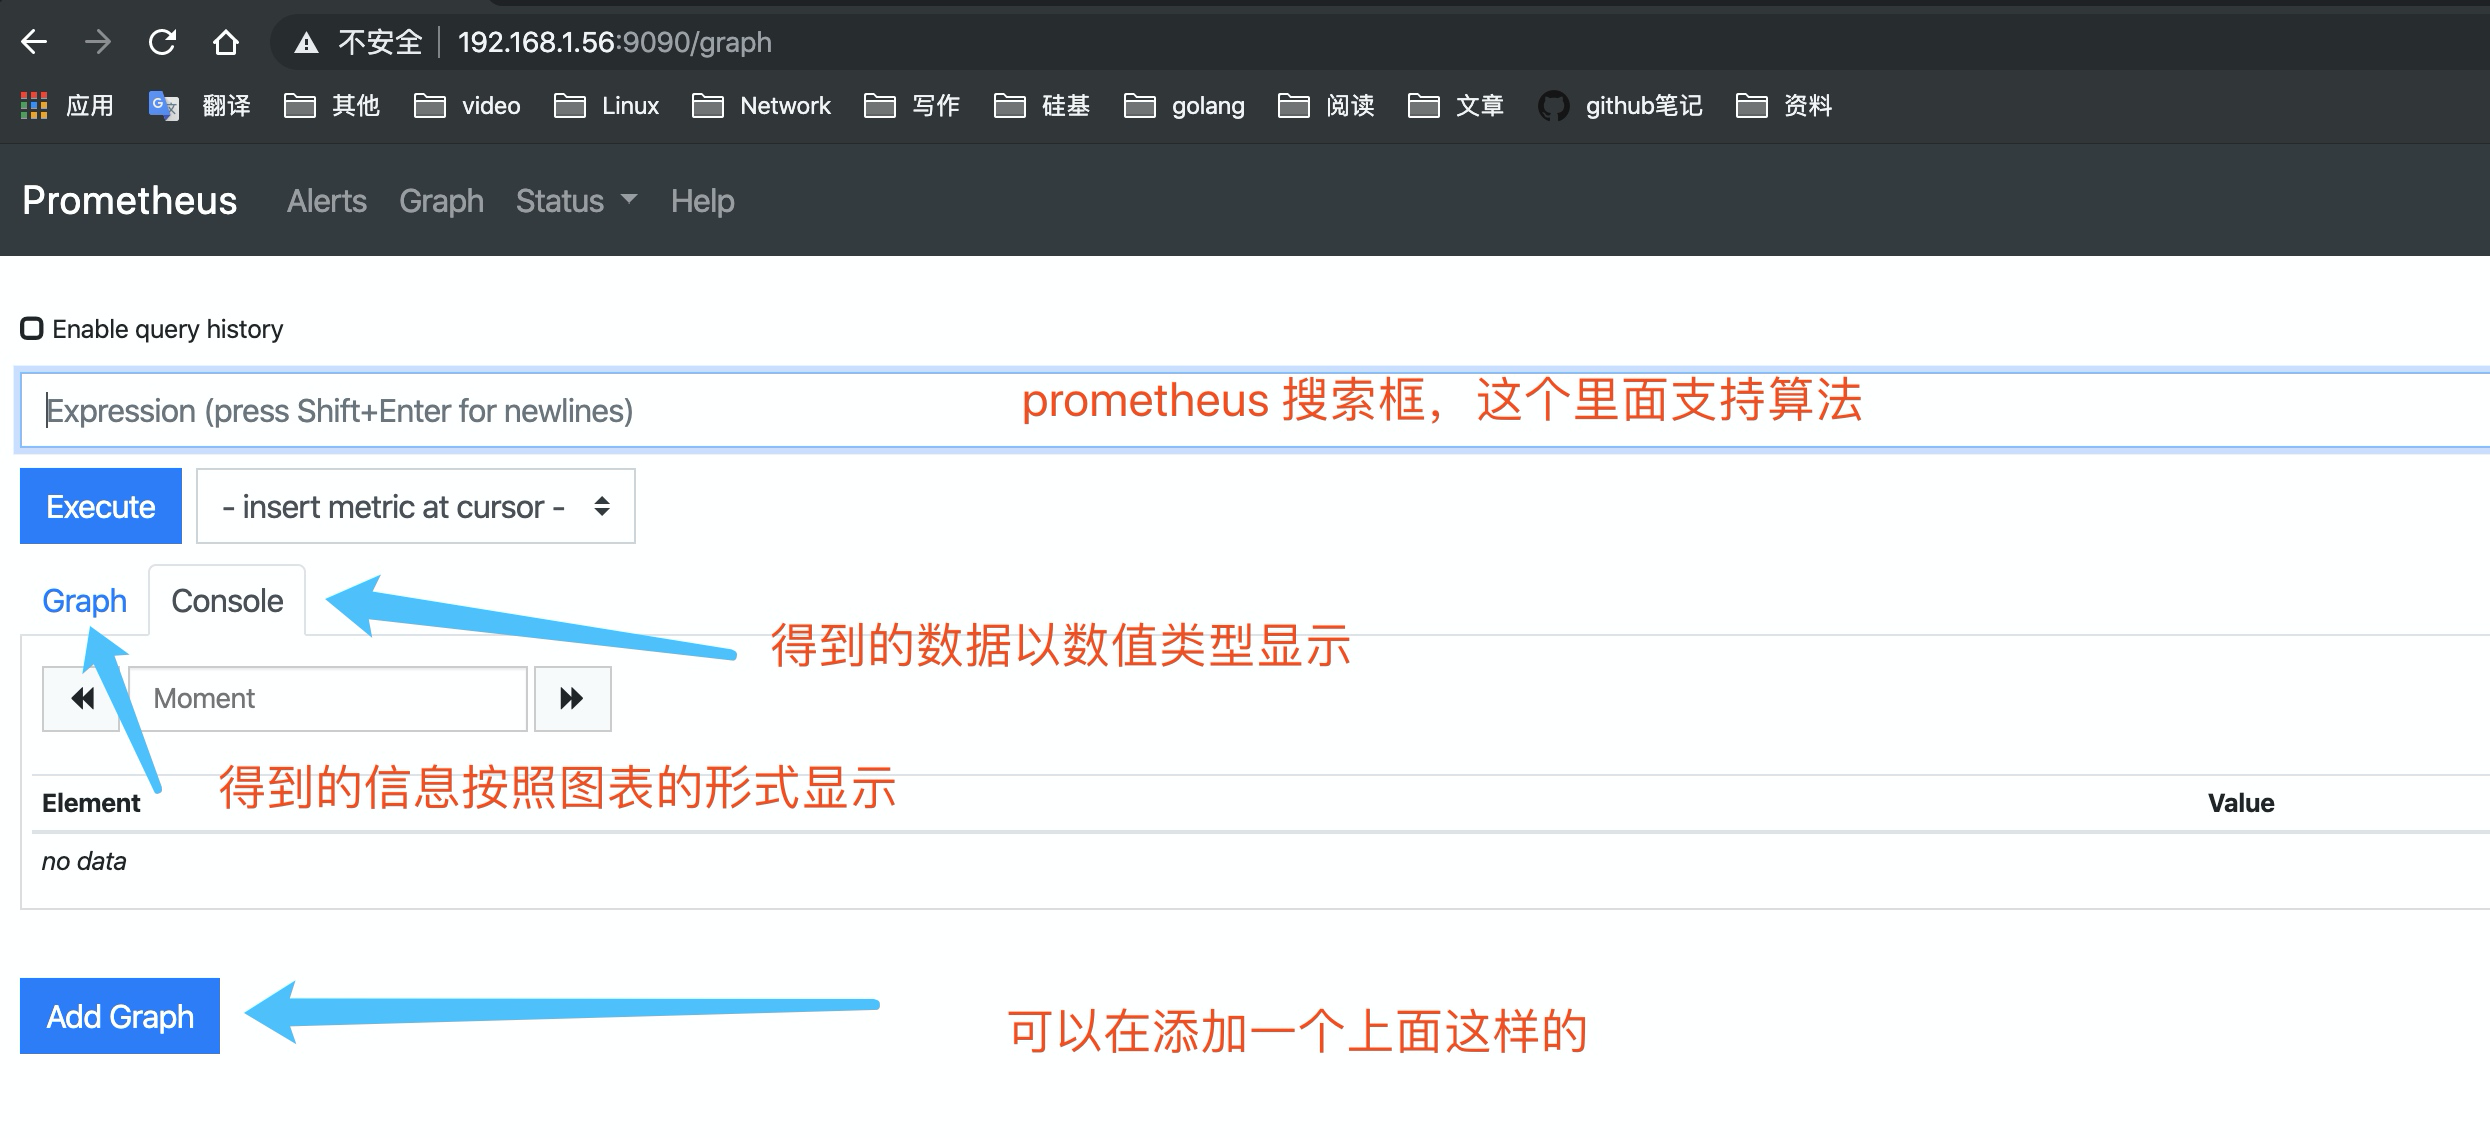
免责声明:本站发布的内容(图片、视频和文字)以原创、转载和分享为主,文章观点不代表本网站立场,如果涉及侵权请联系站长邮箱:is@yisu.com进行举报,并提供相关证据,一经查实,将立刻删除涉嫌侵权内容。


