这篇文章主要介绍了如何利用Python进行数据可视化,具有一定借鉴价值,感兴趣的朋友可以参考下,希望大家阅读完这篇文章之后大有收获,下面让小编带着大家一起了解一下。
Python主要应用于:1、Web开发;2、数据科学研究;3、网络爬虫;4、嵌入式应用开发;5、游戏开发;6、桌面应用开发。
用 Python 简单便捷的完成数据可视化。
其实利用 Python 可视化数据并不是很麻烦,因为 Python 中有两个专用于可视化的库 matplotlib 和 seaborn 能让我们很容易的完成任务。
Matplotlib:基于Python的绘图库,提供完全的 2D 支持和部分 3D 图像支持。在跨平台和互动式环境中生成高质量数据时,matplotlib 会很有帮助。也可以用作制作动画。
Seaborn:该 Python 库能够创建富含信息量和美观的统计图形。Seaborn 基于 matplotlib,具有多种特性,比如内置主题、调色板、可以可视化单变量数据、双变量数据,线性回归数据和数据矩阵以及统计型时序数据等,能让我们创建复杂的可视化图形。
我们用 Python 可以做出哪些可视化图形?
那么这里可能有人就要问了,我们为什么要做数据可视化?比如有下面这个图表:

当然如果你把这张图表丢给别人,他们倒是也能看懂,但无法很直观的理解其中的信息,而且这种形式的图表看上去也比较 low,这个时候我们如果换成直观又美观的可视化图形,不仅能突显逼格,也能让人更容易的看懂数据。
下面我们就用上面这个简单的数据集作为例子,展示用 Python 做出9种可视化效果,并附有相关代码。
导入数据集
import matplotlib.pyplot as plt
import pandas as pd
df=pd.read_excel("E:/First.xlsx", "Sheet1")
可视化为直方图
fig=plt.figure() #Plots in matplotlib reside within a figure object, use plt.figure to create new figure
#Create one or more subplots using add_subplot, because you can't create blank figure
ax = fig.add_subplot(1,1,1)
#Variable
ax.hist(df['Age'],bins = 7) # Here you can play with number of bins
Labels and Tit
plt.title('Age distribution')
plt.xlabel('Age')
plt.ylabel('#Employee')
plt.show()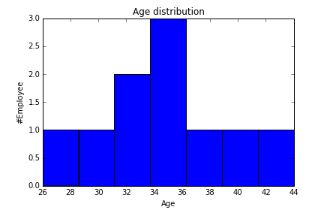
可视化为箱线图
import matplotlib.pyplot as plt
import pandas as pd
fig=plt.figure()
ax = fig.add_subplot(1,1,1)
#Variable
ax.boxplot(df['Age'])
plt.show()

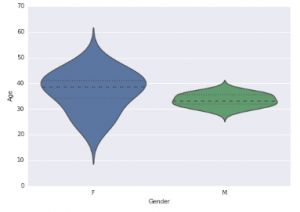
可视化为小提琴图
import seaborn as sns
sns.violinplot(df['Age'], df['Gender']) #Variable Plot
sns.despine()
可视化为条形图
var = df.groupby('Gender').Sales.sum() #grouped sum of sales at Gender level
fig = plt.figure()
ax1 = fig.add_subplot(1,1,1)
ax1.set_xlabel('Gender')
ax1.set_ylabel('Sum of Sales')
ax1.set_title("Gender wise Sum of Sales")
var.plot(kind='bar')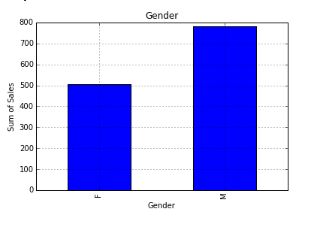
可视化为折线图
var = df.groupby('BMI').Sales.sum()
fig = plt.figure()
ax1 = fig.add_subplot(1,1,1)
ax1.set_xlabel('BMI')
ax1.set_ylabel('Sum of Sales')
ax1.set_title("BMI wise Sum of Sales")
var.plot(kind='line')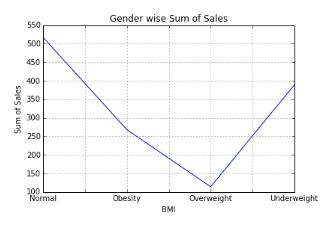
可视化为堆叠柱状图
var = df.groupby(['BMI','Gender']).Sales.sum()
var.unstack().plot(kind='bar',stacked=True, color=['red','blue'], grid=False)

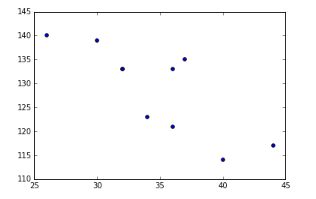
可视化为散点图
fig = plt.figure()
ax = fig.add_subplot(1,1,1)
ax.scatter(df['Age'],df['Sales']) #You can also add more variables here to represent color and size.
plt.show()
可视化为泡泡图
fig = plt.figure()
ax = fig.add_subplot(1,1,1)
ax.scatter(df['Age'],df['Sales'], s=df['Income']) # Added third variable income as size of the bubble
plt.show()

可视化为饼状图
var=df.groupby(['Gender']).sum().stack()
temp=var.unstack()
type(temp)
x_list = temp['Sales']
label_list = temp.index
pyplot.axis("equal") #The pie chart is oval by default. To make it a circle use pyplot.axis("equal")
#To show the percentage of each pie slice, pass an output format to the autopctparameter
plt.pie(x_list,labels=label_list,autopct="%1.1f%%")
plt.title("Pastafarianism expenses")
plt.show()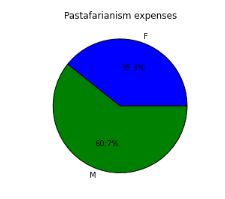
可视化为热度图
import numpy as np
#Generate a random number, you can refer your data values also
data = np.random.rand(4,2)
rows = list('1234') #rows categories
columns = list('MF') #column categories
fig,ax=plt.subplots()
#Advance color controls
ax.pcolor(data,cmap=plt.cm.Reds,edgecolors='k')
ax.set_xticks(np.arange(0,2)+0.5)
ax.set_yticks(np.arange(0,4)+0.5)
# Here we position the tick labels for x and y axis
ax.xaxis.tick_bottom()
ax.yaxis.tick_left()
#Values against each labels
ax.set_xticklabels(columns,minor=False,fontsize=20)
ax.set_yticklabels(rows,minor=False,fontsize=20)
plt.show()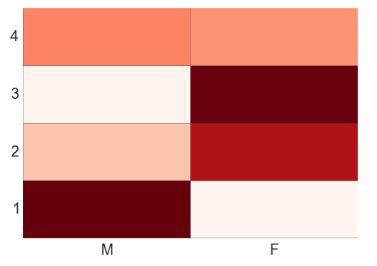
你也可以自己试着根据两个变量比如性别(X 轴)和 BMI(Y 轴)绘出热度图。
感谢你能够认真阅读完这篇文章,希望小编分享的“如何利用Python进行数据可视化”这篇文章对大家有帮助,同时也希望大家多多支持亿速云,关注亿速云行业资讯频道,更多相关知识等着你来学习!
免责声明:本站发布的内容(图片、视频和文字)以原创、转载和分享为主,文章观点不代表本网站立场,如果涉及侵权请联系站长邮箱:is@yisu.com进行举报,并提供相关证据,一经查实,将立刻删除涉嫌侵权内容。


