pythonдёӯmatlibplotеҰӮдҪ•з»ҳеҲ¶3DеӣҫеҪў
иҝҷзҜҮж–Үз« дё»иҰҒд»Ӣз»ҚдәҶpythonдёӯmatlibplotеҰӮдҪ•з»ҳеҲ¶3DеӣҫеҪўпјҢе…·жңүдёҖе®ҡеҖҹйүҙд»·еҖјпјҢж„ҹе…ҙи¶Јзҡ„жңӢеҸӢеҸҜд»ҘеҸӮиҖғдёӢпјҢеёҢжңӣеӨ§е®¶йҳ…иҜ»е®ҢиҝҷзҜҮж–Үз« д№ӢеҗҺеӨ§жңү收иҺ·пјҢдёӢйқўи®©е°Ҹзј–еёҰзқҖеӨ§е®¶дёҖиө·дәҶи§ЈдёҖдёӢгҖӮ
python matlibplotз»ҳеҲ¶3DеӣҫеҪўзҡ„е…·дҪ“д»Јз ҒпјҢдҫӣеӨ§е®¶еҸӮиҖғпјҢе…·дҪ“еҶ…е®№еҰӮдёӢ
1гҖҒж•ЈзӮ№еӣҫдҪҝз”Ёscatter
from mpl_toolkits.mplot3d import Axes3D
import numpy as np
from matplotlib import pyplot as plt
# з”ҹжҲҗ3DзӨәдҫӢж•°жҚ®
mu_vec1 = np.array([0,0,0]) # еқҮеҖјеҗ‘йҮҸ
cov_mat1 = np.array([[1,0,0],[0,1,0],[0,0,1]]) # еҚҸж–№е·®зҹ©йҳө
class1_sample = np.random.multivariate_normal(mu_vec1, cov_mat1, 20)
class2_sample = np.random.multivariate_normal(mu_vec1 + 1, cov_mat1, 20)
class3_sample = np.random.multivariate_normal(mu_vec1 + 2, cov_mat1, 20)
# class1_sample.shape -> (20, 3), 20 rows, 3 columns
fig = plt.figure(figsize=(8,8))
ax = fig.add_subplot(111, projection='3d')
ax.scatter(class1_sample[:,0], class1_sample[:,1], class1_sample[:,2],
marker='x', color='blue', s=40, label='class 1')
ax.scatter(class2_sample[:,0], class2_sample[:,1], class2_sample[:,2],
marker='o', color='green', s=40, label='class 2')
ax.scatter(class3_sample[:,0], class3_sample[:,1], class3_sample[:,2],
marker='^', color='red', s=40, label='class 3')
ax.set_xlabel('variable X')
ax.set_ylabel('variable Y')
ax.set_zlabel('variable Z')
plt.title('3D Scatter Plot')
plt.show()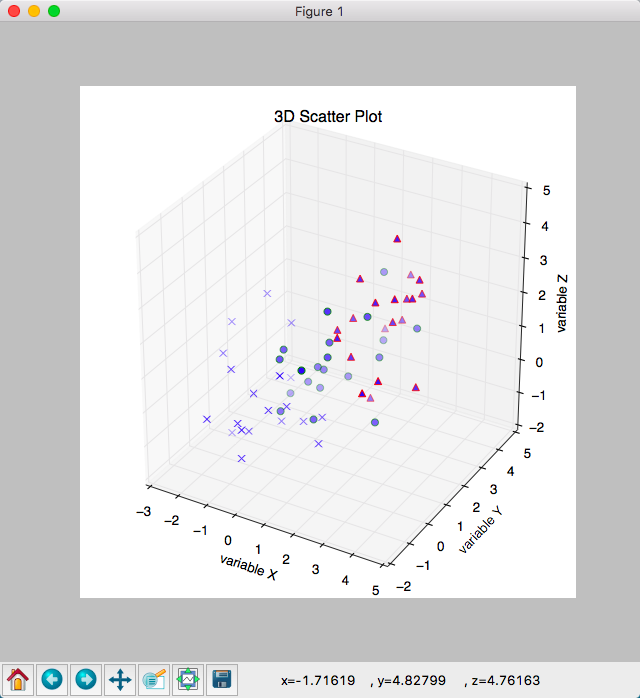
2гҖҒзӣҙзәҝдҪҝз”Ёplot3D
from mpl_toolkits.mplot3d import Axes3D
import matplotlib.pyplot as plt
import numpy as np
from itertools import product, combinations
fig = plt.figure(figsize=(7,7))
ax = fig.gca(projection='3d')
ax.set_aspect("equal")
# з”»зӮ№
# з«Ӣж–№дҪ“йҮҢзҡ„зӮ№
X_inside = np.array([[0,0,0],[0.2,0.2,0.2],[0.1, -0.1, -0.3]])
X_outside = np.array([[-1.2,0.3,-0.3],[0.8,-0.82,-0.9],[1, 0.6, -0.7],
[0.8,0.7,0.2],[0.7,-0.8,-0.45],[-0.3, 0.6, 0.9],
[0.7,-0.6,-0.8]])
for row in X_inside:
ax.scatter(row[0], row[1], row[2], color="r", s=50, marker='^')
for row in X_outside:
ax.scatter(row[0], row[1], row[2], color="k", s=50)
# з”»з«Ӣж–№дҪ“
h = [-0.5, 0.5]
for s, e in combinations(np.array(list(product(h,h,h))), 2):
if np.sum(np.abs(s-e)) == h[1]-h[0]:
ax.plot3D(*zip(s,e), color="g")
ax.set_xlim(-1.5, 1.5)
ax.set_ylim(-1.5, 1.5)
ax.set_zlim(-1.5, 1.5)
plt.show()
pythonжҳҜд»Җд№Ҳж„ҸжҖқ
PythonжҳҜдёҖз§Қи·Ёе№іеҸ°зҡ„гҖҒе…·жңүи§ЈйҮҠжҖ§гҖҒзј–иҜ‘жҖ§гҖҒдә’еҠЁжҖ§е’Ңйқўеҗ‘еҜ№иұЎзҡ„и„ҡжң¬иҜӯиЁҖпјҢе…¶жңҖеҲқзҡ„и®ҫи®ЎжҳҜз”ЁдәҺзј–еҶҷиҮӘеҠЁеҢ–и„ҡжң¬пјҢйҡҸзқҖзүҲжң¬зҡ„дёҚж–ӯжӣҙж–°е’Ңж–°еҠҹиғҪзҡ„ж·»еҠ пјҢеёёз”ЁдәҺз”ЁдәҺејҖеҸ‘зӢ¬з«Ӣзҡ„йЎ№зӣ®е’ҢеӨ§еһӢйЎ№зӣ®гҖӮ
ж„ҹи°ўдҪ иғҪеӨҹи®Өзңҹйҳ…иҜ»е®ҢиҝҷзҜҮж–Үз« пјҢеёҢжңӣе°Ҹзј–еҲҶдә«зҡ„вҖңpythonдёӯmatlibplotеҰӮдҪ•з»ҳеҲ¶3DеӣҫеҪўвҖқиҝҷзҜҮж–Үз« еҜ№еӨ§е®¶жңүеё®еҠ©пјҢеҗҢж—¶д№ҹеёҢжңӣеӨ§е®¶еӨҡеӨҡж”ҜжҢҒдәҝйҖҹдә‘пјҢе…іжіЁдәҝйҖҹдә‘иЎҢдёҡиө„и®Ҝйў‘йҒ“пјҢжӣҙеӨҡзӣёе…ізҹҘиҜҶзӯүзқҖдҪ жқҘеӯҰд№ !


