这篇文章将为大家详细讲解有关python+matplotlib如何绘制3D条形图,小编觉得挺实用的,因此分享给大家做个参考,希望大家阅读完这篇文章后可以有所收获。
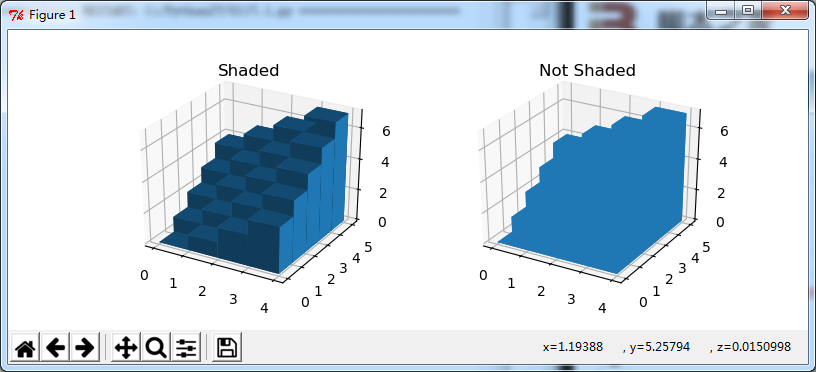
首先看看演示效果:
完整代码如下:
import numpy as np
import matplotlib.pyplot as plt
from mpl_toolkits.mplot3d import Axes3D


# setup the figure and axes
fig = plt.figure(figsize=(8, 3))
ax1 = fig.add_subplot(121, projection='3d')
ax2 = fig.add_subplot(122, projection='3d')

# fake data
_x = np.arange(4)
_y = np.arange(5)
_xx, _yy = np.meshgrid(_x, _y)
x, y = _xx.ravel(), _yy.ravel()

top = x + y
bottom = np.zeros_like(top)
width = depth = 1

ax1.bar3d(x, y, bottom, width, depth, top, shade=True)
ax1.set_title('Shaded')

ax2.bar3d(x, y, bottom, width, depth, top, shade=False)
ax2.set_title('Not Shaded')

plt.show()
shade=True/False,使阴影可见/不可见。
关于“python+matplotlib如何绘制3D条形图”这篇文章就分享到这里了,希望以上内容可以对大家有一定的帮助,使各位可以学到更多知识,如果觉得文章不错,请把它分享出去让更多的人看到。
免责声明:本站发布的内容(图片、视频和文字)以原创、转载和分享为主,文章观点不代表本网站立场,如果涉及侵权请联系站长邮箱:is@yisu.com进行举报,并提供相关证据,一经查实,将立刻删除涉嫌侵权内容。


