这篇文章主要介绍了Vue中怎么使用vue2-highcharts实现top功能,具有一定借鉴价值,感兴趣的朋友可以参考下,希望大家阅读完这篇文章之后大有收获,下面让小编带着大家一起了解一下。
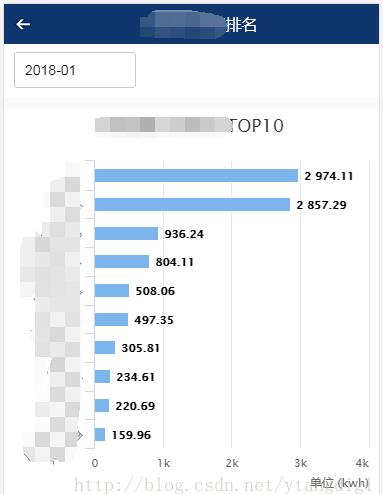
1、要实现的效果如下图:
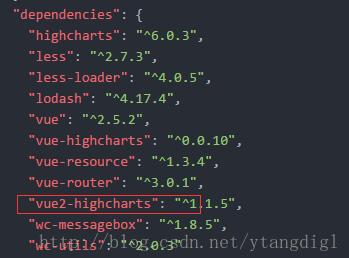
2、首先项目中引用vue2-highcharts
package.json中如下:
在命令行中输入:
cnpm install vue2-highcharts
3、页面代码如下:
<template>
 <div >
  <div>
  <div id="transparent-header" class="rank-head container" >
    <img src="../assets/index/back.png" class="rank-head-back" @click="routerBack"/>
    <span >用能排名</span>
  </div>
  </div>
  <div >
   <div >
    <datepicker v-on:picked="picked" ></datepicker>
   </div>
    <div >
    </div>
  </div>
  <div >
   <div class="charts">
     <vue-highcharts :options="options" ref="maxLineCharts"></vue-highcharts>
   </div>
  </div>
  <div >
   <div class="charts">
     <vue-highcharts :options="options" ref="minLineCharts"></vue-highcharts>
   </div>
  </div>
 </div>
</template>
<script>
 import datepicker from '../components/datepicker.vue'
 import VueHighcharts from 'vue2-highcharts'
 export default {
 data() {
  return{
   topHeight:240,
   freezeMon:'',
   ownerFreeData: [],
   options:{
    credits: {
     enabled: false
    },
    legend: {
     enabled: false
    },
    global: {
     useUTC: false
    },
    chart: {
     type: 'bar'
    },
    title: {
     text: ' '
    },
    subtitle: {
     text: ''
    },
    xAxis:[{
     categories: ['1', '2', '3', '4', '5','6', '7', '8', '9', '10'],
     title: {
      text: null
     },
    labels: {
     rotation: -45
    }
     }],
    yAxis:[{
      min: 0,
      labels:{
       overflow: 'justify'
      },
      title: {
       text: '单位 (kwh)',
       align: 'high'
       }
    }],
    tooltip: {
      formatter: function(){
      return this.x+':'+this.y+'kwh';
     }
    },
    credits: {
     enabled: false
    },
    plotOptions: {
     bar: {
      dataLabels: {
       enabled: true
      }
     },
    series: [{
     type: 'bar'
    }]
    }
   }
  }
 },
  methods: {
  picked(year, month, date) {
   if(month < 10){
    this.freezeMon = `${year}-0${month}`;
   }else{
    this.freezeMon = `${year}-${month}`;
   }
   this.getList();
  },
  routerBack(){
   this.$router.go(-1);
  },
  getList(){
   let maxLineCharts = this.$refs.maxLineCharts;
   let minLineCharts = this.$refs.minLineCharts;
   if(maxLineCharts != null && minLineCharts != null){
    //移除所有Series
    maxLineCharts.removeSeries();
    minLineCharts.removeSeries();
//设置标题名
   maxLineCharts.getChart().title.update({ text: '用能最大TOP10' });
    minLineCharts.getChart().title.update({ text: '用能最小TOP10' });
    var userType = sessionStorage.getItem('userType');
    var areaCode = sessionStorage.getItem('areaCode');
    this.$http.post(this.URLINFO + '/mobile/rankingMonitor/getDayFreezeApp.do',{yearMonth:this.freezeMon,userType:userType,areaCode:areaCode})
    .then(function (res) {
      var seriesData = []
      var categoriesData = []
      for(var i = 0;i < res.data.max.length; i++) {
        //maxLineCharts.addSeries({name:res.data.max[i][1],data: [{name: res.data.max[i][1],y:res.data.max[i][2]}]});
        seriesData.push([res.data.max[i][1],res.data.max[i][2]]);
        categoriesData.push(res.data.max[i][1]);
      }
      maxLineCharts.addSeries({name: '用能',data: seriesData});
      maxLineCharts.getChart().xAxis[0].setCategories(categoriesData);
      seriesData = []
      categoriesData = []
      for(var i = 0;i < res.data.min.length; i++) {
        //minLineCharts.addSeries({name:res.data.min[i][1],data: [{name: res.data.min[i][1],y:res.data.min[i][2]}]});
        seriesData.push([res.data.min[i][1],res.data.min[i][2]]);
        categoriesData.push(res.data.min[i][1]);
      }
      minLineCharts.addSeries({name: '用能',data: seriesData});
      minLineCharts.getChart().xAxis[0].setCategories(categoriesData);
    })
    .catch(function (error) {
      this.$toast('查询排名信息异常');
    });
   }
  }
  },
 components: {
   datepicker,
  VueHighcharts
  },
 mounted () {
  this.getList()
 }
 }
</script>
<style>
*{margin:0;padding:0; list-style:none }
h2,h3,h4,h5,h6,h7{font-size:16px; font-weight:normal;}
.rank-head{
  width: 100%;
  height: 40px;
  position:fixed;
  background: -webkit-linear-gradient(top,rgba(0,0,0,.6),rgba(0,0,0,0));
  z-index: 999;
  color: #fff;
  font-size: 16px;
  text-align: center;
  line-height: 40px;
}
.container{
  width: 100%;
  overflow: hidden
}
.rank-head-back{
  display: block;
  float: left;
  width: 40px;
  height: 40px;
  background: url("../assets/index/back.png") no-repeat center center;
  background-size: 100% 100%;
}
</style>
感谢你能够认真阅读完这篇文章,希望小编分享的“Vue中怎么使用vue2-highcharts实现top功能”这篇文章对大家有帮助,同时也希望大家多多支持亿速云,关注亿速云行业资讯频道,更多相关知识等着你来学习!
免责声明:本站发布的内容(图片、视频和文字)以原创、转载和分享为主,文章观点不代表本网站立场,如果涉及侵权请联系站长邮箱:is@yisu.com进行举报,并提供相关证据,一经查实,将立刻删除涉嫌侵权内容。


