用ELK打造强大的日志分析平台,具体拓扑结构如下:
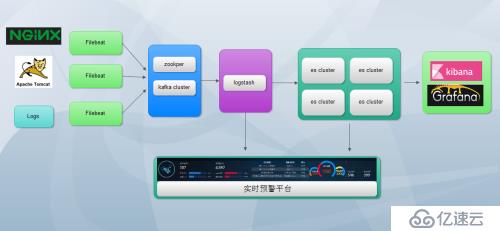
在这里我们将进行kafka+filebeat+ELK5.4的部署
各软件版本
jdk-8u131-linux-i586.tar.gz
filebeat-5.4.0-linux-x86_64.tar.gz
elasticsearch-5.4.0.tar.gz
kibana-5.4.0-linux-x86_64.tar.gz
logstash-5.4.0.tar.gz
kafka_2.11-0.10.0.0.tgz
1、JDK安装配置(略过)
2、ELK安装与配置
创建ELK用户,并进行文件解压

1.elasticsearch配置

[elk@localhost elasticsearch-5.4.0]$ vi config/elasticsearch.yml
.....
network.host: 192.168.12.109
#
# Set a custom port for HTTP:
#
http.port: 9200

..........

保存,启动
[elk@localhost elasticsearch-5.4.0]$ nohup bin/elasticsearch &
验证
#
[elk@localhost elasticsearch-5.4.0]$ curl http://192.168.12.109:9200
{
  "name" : "aCA2ApK",
  "cluster_name" : "elasticsearch",
  "cluster_uuid" : "Ea4_9kXZSaeDL1fYt4lUUQ",
  "version" : {
    "number" : "5.4.0",
    "build_hash" : "780f8c4",
    "build_date" : "2017-04-28T17:43:27.229Z",
    "build_snapshot" : false,
    "lucene_version" : "6.5.0"
  },
  "tagline" : "You Know, for Search"
}

2、kibana安装与配置

[elk@localhost kibana-5.4.0-linux-x86_64]$ vi config/kibana.yml
## Kibana is served by a back end server. This setting specifies the port to use.
server.port: 5601

# Specifies the address to which the Kibana server will bind. IP addresses and host names are both valid values.
# The default is 'localhost', which usually means remote machines will not be able to connect.
# To allow connections from remote users, set this parameter to a non-loopback address.
server.host: "192.168.12.109"
..........
# The URL of the Elasticsearch instance to use for all your queries.
elasticsearch.url: "http://192.168.12.109:9200"
..........
[elk@localhost kibana-5.4.0-linux-x86_64]$ nohup bin/kibana &

在浏览器访问  能访问即可
3、kafka安装与配置
这里我们只做单机192.168.12.105部署单节点《centos kafka单包单机部署》
4、logstah安装与配置
[elk@localhost logstash-5.4.0]$ vi nginx.conf    这里新生成一个配置文件

input {
       kafka  {
       codec => "json"
     topics_pattern => "logstash-.*"
     bootstrap_servers => "192.168.12.105:9092"
     auto_offset_reset => "latest"
     group_id => "logstash-g1"
  }


}

filter {
    if "nginx-accesslog" in [tags] {
        grok {
                match => { "message" => "%{IPORHOST:http_host} %{IPORHOST:clientip} - %{USERNAME:remote_user} \[%{HTTPDATE:timestamp}\] \"(?:%{WORD:http_verb} %{NOTSPACE:http_request}(?: HTTP/%{NUMBER:http_version})?|%{DATA:raw_http_request})\" %{NUMBER:response} (?:%{NUMBER:bytes_read}|-) %{QS:referrer} %{QS:agent} %{QS:xforwardedfor} %{NUMBER:request_time:float} %{GREEDYDATA:traceID}"}
        }
        mutate {
                convert => ["status","integer"]
                convert => ["body_bytes_sent","integer"]
                convert => ["request_time","float"]
        }
        geoip {
                source=>"remote_addr"
        }
        date {
                match => [ "timestamp","dd/MMM/YYYY:HH:mm:ss Z"]
        }
        useragent {
                source=>"http_user_agent"
        }
}


    if "tomcat-accesslog"  in [tags] {
        grok {
           match => { "message" => "%{IPORHOST:clientip} \[%{HTTPDATE:timestamp}\] \"(?:%{WORD:http_verb} %{NOTSPACE:http_request}(?: HTTP/%{NUMBER:http_version})?|%{DATA:raw_http_request})\" %{NUMBER:response} (?:%{NUMBER:bytes_read}|-) %{QS:referrer} %{NUMBER:request_time:float} %{GREEDYDATA:traceID}"}
            }
        date {
               match => [ "timestamp","dd/MMM/YYYY:HH:mm:ss Z"]
        }
}
}

output {

    elasticsearch {
      hosts => ["192.168.12.109:9200"]
        index => "logstash-%{type}-%{+YYYY.MM.dd}"
        document_type => "%{type}"
    }

#stdout { codec => rubydebug }
}

保存,并启动
[elk@localhost logstash-5.4.0]$ nohup bin/logstash -f nginx.conf &
5、filebeat安装与配置
将filebeat分别拷贝到需要采集的服务器,进行解压,在这里我们分别采集Nginx,tomcat日志
Nginx服务器
[user@localhost filebeat-5.4.0-linux-x86_64]$ vi filebeat.yml
filebeat.prospectors:
- input_type: log
  paths:
    - /data/programs/nginx/logs/access.log
  tags: ["nginx-accesslog"]
  document_type: nginxaccess
tags: ["nginx-test-194"]
output.kafka:
  enabled: true
  hosts: ["192.168.12.105:9092"]
  topic: logstash-%{[type]}


[user@localhost filebeat-5.4.0-linux-x86_64]$nohup filebeat -c filebeat.yml &
tomcat服务器
[user@localhost filebeat-5.4.0-linux-x86_64]$ vi filebeat.yml
filebeat.yml
filebeat.prospectors:
- input_type: log
paths:
- /data/tomcat/logs/localhost_access_log*
tags: ["tomcat-accesslog"]
document_type: tomcataccess
tags: ["tomcat103"]
output.kafka:
enabled: true
hosts: ["192.168.12.105:9092"]
topic: logstash-%{[type]}
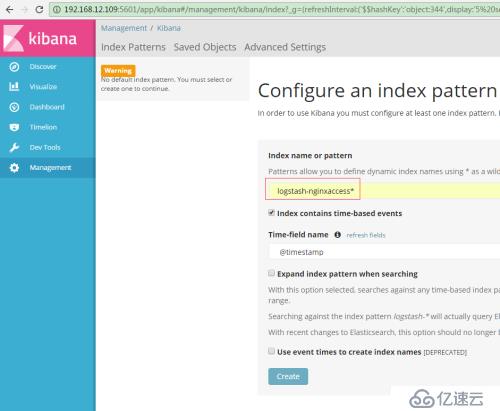
[user@localhost filebeat-5.4.0-linux-x86_64]$nohup filebeat -c filebeat.yml &完成以上,我们的平台就搭建好了,接下来我们创建索引
输入:logstash-nginxaccess*
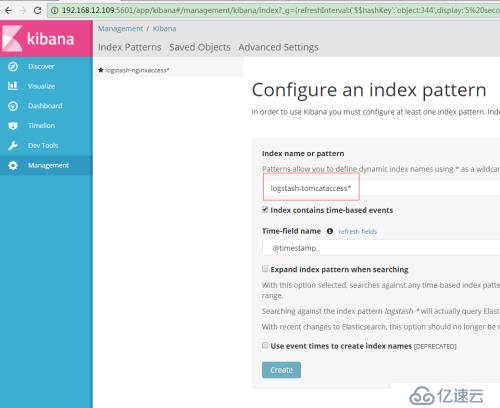
输入logstash-tomcataccess*
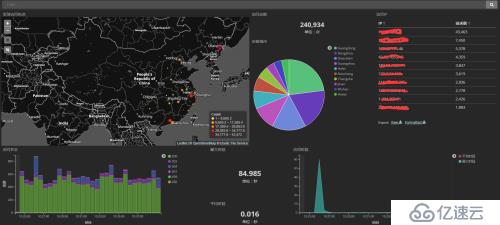
数据通过filebeat到kafka、ELK成功展示出来
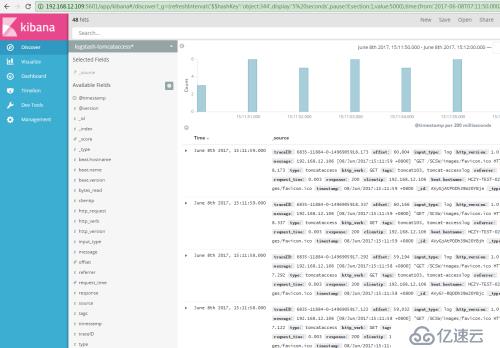
来张炫图
免责声明:本站发布的内容(图片、视频和文字)以原创、转载和分享为主,文章观点不代表本网站立场,如果涉及侵权请联系站长邮箱:is@yisu.com进行举报,并提供相关证据,一经查实,将立刻删除涉嫌侵权内容。


