查看整体负载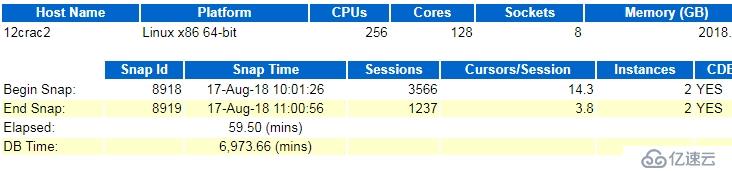
cpu使用居高不下;基本上整体CPU是百分80%以上了;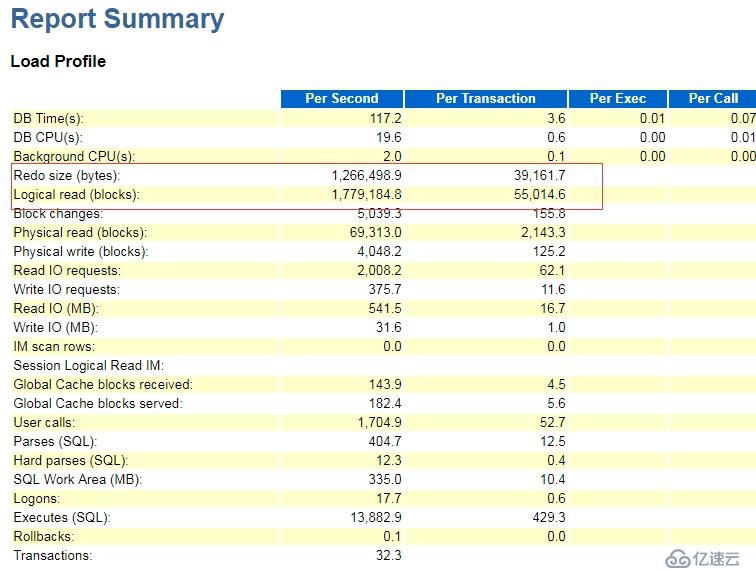
此时:物理读600MB/s,REDO也不算太高;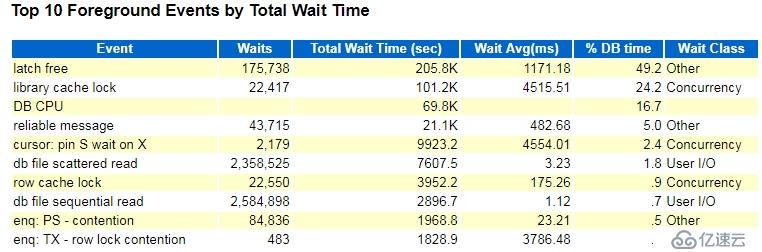
全为latch free,一般为bug高发区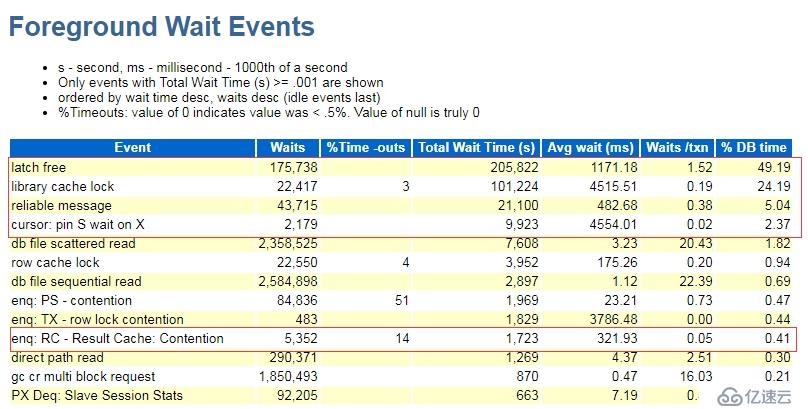
检查相关SQL
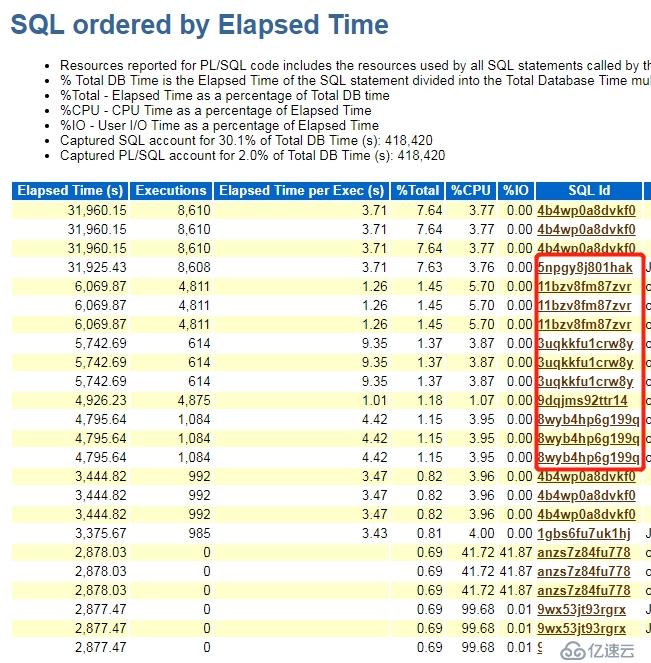
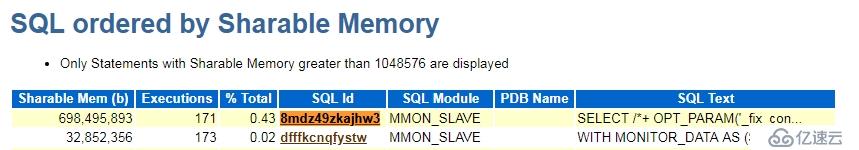
基本为系统SQL:4b4wp0a8dvkf0,11bzv8fm87zvr,3uqkkfu1crw8y,frjd8zfy2jfdq,8mdz49zkajhw3
相关BUG:
1 Frequent Execution of Recursive Sql Metrics Collector SQL_ID "frjd8zfy2jfdq" in 12.1.0.2 (Doc ID 2059121.1)
alter sysetm set _OPTIMIZER_DYNAMIC_SAMPLING=0
2 Very Long Parse Time for Queries in InMemory Database (Doc ID 2102106.1)
High “Latch Free” Waits with Contention on ‘Result Cache: RC Latch’ when RESULT_CACHE_MODE = MANUAL on Oracle 12c (Doc ID 2002089.1)
alter system set "_optimizer_ads_use_result_cache" = FALSE
3 Bug 18511269 : ORA-600 [KKSGAGETNOALLOC_INT0] RUNNING WORKLOAD & ONLINE REDEF CONCURRENTLY (Doc ID 2175884.1)
SYMPTOMS
Following error is reported on the alert log and trace file may contain the following information:
Dump continued from file: /u01/app/oracle/diag/rdbms/flowr/FLOWR2/trace/FLOWR2_ora_31705.trc
[TOC00001]
ORA-00600: internal error code, arguments: [kksgaGetNoAlloc_Int0], [11], [11], [], [], [], [], [], [], [], [], []
----- Current SQL Statement for this session (sql_id=4b4wp0a8dvkf0) -----
SELECT executions, end_of_fetch_count, elapsed_time/px_servers elapsed_time, cpu_time/px_servers cpu_time, buffer_gets/executions buffer_gets FROM (SELECT sum(executions_delta) as EXECUTIONS, sum(case when px_servers_execs_delta > 0 then px_servers_execs_delta else executions_delta end) as px_servers, sum(end_of_fetch_count_delta) as end_of_fetch_count, sum(elapsed_time_delta) as ELAPSED_TIME, sum(cpu_time_delta) as CPU_TIME, sum(buffer_gets_delta) as BUFFER_GETS FROM DBA_HIST_SQLSTAT s, V$DATABASE d, DBA_HIST_SNAPSHOT sn WHERE s.dbid = d.dbid AND bitand(nvl(s.flag, 0), 1) = 0 AND sn.end_interval_time > (select systimestamp at TIME ZONE dbtimezone from dual) - 7 AND s.sql_id = :1 AND s.snap_id = sn.snap_id AND s.instance_number = sn.instance_number AND s.dbid = sn.dbid AND parsing_schema_name = :2)
[TOC00004-END]
client details:
O/S info: user: , term: , ospid: 31700
machine: 3012 program: perl@***** (TNS V1-V3)
application name: Oracle Enterprise Manager.Metric Engine, hash value=2371535196
这个BUG只能打补丁;
4 8mdz49zkajhw3,ORA-4031 During Automatic Report Flush Query Execution After Upgrade To 12.1.0.2 (Doc ID 2330230.1)
To avoid the error use any of below alternatives:
1/ Increase the SGA size by running the SGA_TARGET_ADVISOR and set a minimum size for shared_pool_size based on the recommendation of the shared pool advisor.
2/ Use the workaround:
Turn off the "Automatic Report Flush" feature by setting:
SQL> alter system set "_report_capture_cycle_time"=0; /* Default is 60 seconds */
参考:
Troubleshooting 'cursor: pin S wait on X' waits. (Doc ID 1349387.1)
High Waits On Real-time Descriptor Latch From 12.1.0.1 (Doc ID 2382299.1)
Database Hang on 12c with 'Cursor: Pin S wait on X', 'Row Cache Lock' and 'Library Cache Load Lock' (Doc ID 2127483.1)
12c: 'acknowledge over PGA limit' Wait Event (Doc ID 2138882.1)
High Wait Time for 'cursor: pin S wait on X' Event After Upgrade (Doc ID 1949691.1)
免责声明:本站发布的内容(图片、视频和文字)以原创、转载和分享为主,文章观点不代表本网站立场,如果涉及侵权请联系站长邮箱:is@yisu.com进行举报,并提供相关证据,一经查实,将立刻删除涉嫌侵权内容。


