这期内容当中小编将会给大家带来有关怎么在Python中利用subplot 在一张画布同时画多张图,文章内容丰富且以专业的角度为大家分析和叙述,阅读完这篇文章希望大家可以有所收获。
arg1: 在垂直方向同时画几张图
arg2: 在水平方向同时画几张图
arg3: 当前命令修改的是第几张图
plt.figure()另起一张新的画布
from PIL import Image
import matplotlib.pyplot as plt
image1 = Image.open('1.jpg')
image2 = Image.open('2.jpg')
plt.subplot(121)
plt.imshow(image1)
plt.subplot(122)
plt.imshow(image2)
plt.show()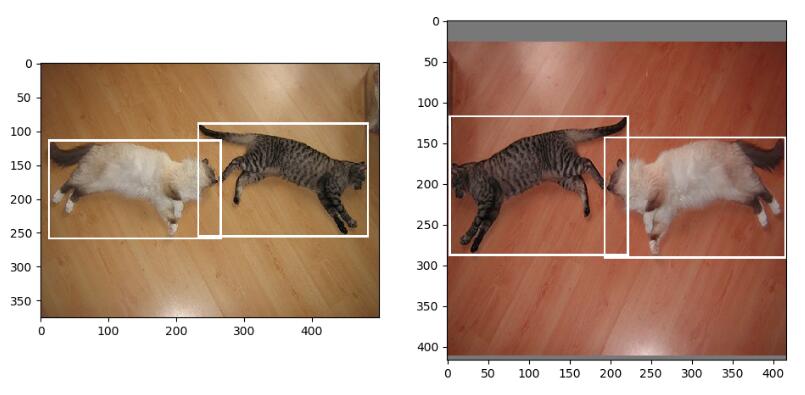
补充:matplotlib 同一个画布绘制多张图,主次刻度,竖线
我就废话不多说了,大家还是直接看代码吧~
import matplotlib.pyplot as plt
import seaborn as sns
sns.set()
# 要分析的数据
profit = df_profit.groupby('release_year')['profit'].agg(['mean','sum','count'])
# 在同一个画布中绘制两张图
plt.figure(figsize=(15,15))
# 图一:每年上映电影的总收入
ax = plt.subplot(211)
# 设置x轴 范围
ax.set_xlim(1958,2018)
# 设置x轴 主刻度,(次刻度设置minor=True)
ax.set_xticks(np.arange(1960,2018,5), minor=False)
# 画图
ax.plot(profit['sum'], linestyle='--', marker='o', markersize=5)
ax.set_title('The Sum of Movies\' Revenue v.s. Release Year')
ax.set_ylabel('Revenue(USD)')
# 增加竖线
ax.axvline(x=1977, color='#d46061', linewidth=1);
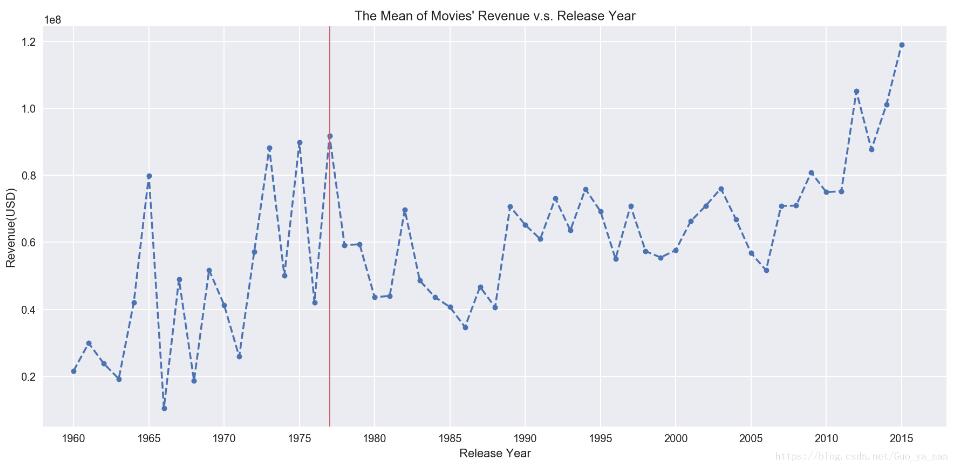
# 图二:每年上映电影的平均收入
ax = plt.subplot(212)
# 设置x轴 范围
ax.set_xlim(1958,2018)
# 设置x轴 主刻度
ax.set_xticks(np.arange(1960,2018,5))
# 画图
ax.plot(profit['mean'], linestyle='--', marker='o', markersize=5);
ax.set_title('The Mean of Movies\' Revenue v.s. Release Year')
ax.set_xlabel('Release Year')
ax.set_ylabel('Revenue(USD)')
# 增加竖线
ax.axvline(x=1977, color='#d46061', linewidth=1);
上述就是小编为大家分享的怎么在Python中利用subplot 在一张画布同时画多张图了,如果刚好有类似的疑惑,不妨参照上述分析进行理解。如果想知道更多相关知识,欢迎关注亿速云行业资讯频道。
免责声明:本站发布的内容(图片、视频和文字)以原创、转载和分享为主,文章观点不代表本网站立场,如果涉及侵权请联系站长邮箱:is@yisu.com进行举报,并提供相关证据,一经查实,将立刻删除涉嫌侵权内容。


