д»Җд№ҲжҳҜзӣ‘жҺ§е·Ҙе…·Linux iotop
иҝҷжңҹеҶ…е®№еҪ“дёӯе°Ҹзј–е°Ҷдјҡз»ҷеӨ§е®¶еёҰжқҘжңүе…ід»Җд№ҲжҳҜзӣ‘жҺ§е·Ҙе…·Linux iotopпјҢж–Үз« еҶ…е®№дё°еҜҢдё”д»Ҙдё“дёҡзҡ„и§’еәҰдёәеӨ§е®¶еҲҶжһҗе’ҢеҸҷиҝ°пјҢйҳ…иҜ»е®ҢиҝҷзҜҮж–Үз« еёҢжңӣеӨ§е®¶еҸҜд»ҘжңүжүҖ收иҺ·гҖӮ
iotopзҡ„з®Җд»Ӣпјҡ
iotopжҳҜдёҖж¬ҫејҖжәҗгҖҒе…Қиҙ№зҡ„з”ЁжқҘзӣ‘жҺ§зЈҒзӣҳI/OдҪҝз”ЁзҠ¶еҶөзҡ„зұ»дјјtopе‘Ҫд»Өзҡ„е·Ҙе…·пјҢiotopеҸҜд»Ҙзӣ‘жҺ§иҝӣзЁӢзҡ„I/OдҝЎжҒҜгҖӮе®ғжҳҜPythonиҜӯиЁҖзј–еҶҷзҡ„пјҢдёҺiostatе·Ҙе…·жҜ”иҫғпјҢiostatжҳҜзі»з»ҹзә§еҲ«зҡ„IOзӣ‘жҺ§пјҢиҖҢiotopжҳҜиҝӣзЁӢзә§еҲ«IOзӣ‘жҺ§гҖӮзӣ®еүҚжңҖж–°зҡ„зүҲжң¬дёәiotop 0.6гҖӮе…¶е®ҳж–№зҪ‘еқҖhttp://guichaz.free.fr/iotop/[1]
iotopзҡ„е®үиЈ…пјҡ
жіЁж„ҸпјҢiotopзҡ„е®үиЈ…жңүеүҚжҸҗжқЎд»¶(еҰӮжһңж“ҚдҪңзі»з»ҹдёҚж»Ўи¶іиҝҷдәӣжқЎд»¶пјҢiotopж— жі•жӯЈзЎ®е®үиЈ…)пјҡ
1пјҡеҶ…ж ёзүҲжң¬дёә2.6.20жҲ–жӣҙй«ҳзүҲжң¬
2пјҡPython 2.7жҲ–жӣҙй«ҳзҡ„зүҲжң¬
е®ҳж–№ж–ҮжЎЈзҡ„иҜҰз»Ҷд»Ӣз»ҚеҰӮдёӢпјҡ
Linux has always been able to show how much I/O was going on (the bi and bo columns of the vmstat 1 command).
Iotop is a Python program with a top like UI used to show of behalf of which process is the I/O going on. It requires Python ≥ 2.7 and a Linux kernel ≥ 2.6.20 with the TASK_DELAY_ACCT CONFIG_TASKSTATS, TASK_IO_ACCOUNTING and CONFIG_VM_EVENT_COUNTERS options on.
iotopзҡ„yumе®үиЈ…
yumе®үиЈ…жҳҜжңҖз®ҖеҚ•гҖҒеҝ«жҚ·зҡ„гҖӮеүҚжҸҗжқЎд»¶жҳҜдҪ жңүй…ҚзҪ®yumзҡ„жәҗй…ҚзҪ®гҖӮ
[root@DB-Server ~]# python -V Python 2.7.5 [root@DB-Server ~]# uname -a Linux DB-Server 3.10.0-862.el7.x86_64 #1 SMP Fri Apr 20 16:44:24 UTC 2018 x86_64 x86_64 x86_64 GNU/Linux [root@DB-Server ~]# [root@DB-Server ~]# yum -y install iotop
iotopзҡ„жәҗз Ғе®үиЈ…
wget http://guichaz.free.fr/iotop/files/iotop-0.6.tar.bz2 tar -xvf iotop-0.6.tar.gz cd iotop-0.6 python setup.py build python setup.py install
iotopзҡ„еҸӮж•°
# iotop --help Usage: /usr/local/sbin/iotop [OPTIONS] DISK READ and DISK WRITE are the block I/O bandwidth used during the sampling period. SWAPIN and IO are the percentages of time the thread spent respectively while swapping in and waiting on I/O more generally. PRIO is the I/O priority at which the thread is running (set using the ionice command). Controls: left and right arrows to change the sorting column, r to invert the sorting order, o to toggle the --only option, p to toggle the --processes option, a to toggle the --accumulated option, i to change I/O priority, q to quit, any other key to force a refresh. Options: --version show program's version number and exit -h, --help show this help message and exit -o, --only only show processes or threads actually doing I/O -b, --batch non-interactive mode -n NUM, --iter=NUM number of iterations before ending [infinite] -d SEC, --delay=SEC delay between iterations [1 second] -p PID, --pid=PID processes/threads to monitor [all] -u USER, --user=USER users to monitor [all] -P, --processes only show processes, not all threads -a, --accumulated show accumulated I/O instead of bandwidth -k, --kilobytes use kilobytes instead of a human friendly unit -t, --time add a timestamp on each line (implies --batch) -q, --quiet suppress some lines of header (implies --batch)
iotopзҡ„еҝ«жҚ·й”®
rпјҡеҸҚеҗ‘жҺ’еәҸпјҢ
oпјҡеҲҮжҚўиҮійҖүйЎ№--onlyпјҢ
pпјҡеҲҮжҚўиҮі--processesйҖүйЎ№пјҢ
aпјҡеҲҮжҚўиҮі--accumulatedйҖүйЎ№
qпјҡйҖҖеҮә
iпјҡж”№еҸҳзәҝзЁӢзҡ„дјҳе…Ҳзә§
iotopзҡ„дҫӢеӯҗ
1пјҡеҸӘжҳҫзӨәжӯЈеңЁдә§з”ҹI/Oзҡ„иҝӣзЁӢ
# iotop -o
2пјҡдҪҝз”ЁйқһдәӨдә’жЁЎејҸе°Ҷiotopе‘Ҫд»Өиҫ“еҮәдҝЎжҒҜеҶҷе…Ҙж—Ҙеҝ—
#nohup iotop -b -o -n 10 -d 5 -t > /tmp/iotop.log &
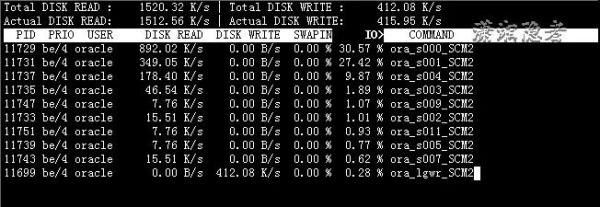
3пјҡеҖҹеҠ©iotopе‘Ҫд»ӨжүҫеҲ°ж¶ҲиҖ—I/OжңҖй«ҳзҡ„иҝӣзЁӢпјҢ然еҗҺйҖҡиҝҮиҝӣзЁӢжүҫеҲ°е…¶жӯЈеңЁжү§иЎҢзҡ„SQLиҜӯеҸҘ
# iotop -oP PID PRIO USER DISK READ DISK WRITE SWAPIN IO> COMMAND 11741 be/4 oracle 4.70 M/s 0.00 B/s 0.00 % 98.60 % ora_s004_SCM2 11739 be/4 oracle 66.99 M/s 0.00 B/s 0.00 % 93.30 % ora_s005_SCM2 11741 be/4 oracle 21.76 M/s 0.00 B/s 0.00 % 91.78 % ora_s006_SCM2 11743 be/4 oracle 4.87 M/s 3.78 M/s 0.00 % 27.74 % ora_s007_SCM2 11745 be/4 oracle 62.39 K/s 0.00 B/s 0.00 % 2.88 % ora_s008_SCM2 11733 be/4 oracle 39.00 K/s 0.00 B/s 0.00 % 2.08 % ora_s002_SCM2 11697 be/4 oracle 0.00 B/s 1879.61 K/s 0.00 % 0.30 % ora_dbw0_SCM2 11699 be/4 oracle 0.00 B/s 102.36 K/s 0.00 % 0.20 % ora_lgwr_SCM2
еңЁжүҫеҲ°ж¶ҲиҖ—I/OжңҖеӨ§зҡ„иҝӣзЁӢеҗҺпјҢжүҫеҮәORACLEиҝӣзЁӢжӯЈеңЁжү§иЎҢзҡ„SQLиҜӯеҸҘ
SQL> @getsql_by_spid.sql Enter value for pid: 11741 old 13: WHERE c.spid = '&pid')) new 13: WHERE c.spid = '11741')) SQL_TEXT -------------------------------------------- ...............................(е®һйҷ…зҺҜеўғдёӯпјҢиҝҷйҮҢдјҡиҫ“еҮәSQLиҜӯеҸҘ)
getsql_by_spid.sqlи„ҡжң¬еҰӮдёӢжүҖзӨәпјҡ
SELECT /*+ ORDERED */ sql_text FROM v$sqltext a WHERE (a.hash_value, a.address) IN ( SELECT DECODE (sql_hash_value, 0, prev_hash_value, sql_hash_value ), DECODE (sql_hash_value, 0, prev_sql_addr, sql_address) FROM v$session b WHERE b.paddr = (SELECT addr FROM v$process c WHERE c.spid = '&pid')) ORDER BY piece ASC /
иҝҷйҮҢеҸӘз®ҖеҚ•еҲ—дәҶеҮ дёӘдҫӢеӯҗпјҢеӣ дёәiotopе‘Ҫд»Өйқһеёёз®ҖеҚ•пјҢдәҶи§Јiotopзҡ„еҸӮж•°е’Ңеҝ«жҚ·ж–№ејҸеҗҺпјҢеҹәжң¬дёҠеҸӘйңҖж №жҚ®е®һйҷ…йңҖжұӮеҺ»иҺ·еҸ–иҝӣзЁӢжҲ–дҝЎжҒҜзҡ„I/OдҝЎжҒҜпјҢеү©дёӢе°ұжҳҜеҲҶжһҗеҲӨж–ӯдәҶгҖӮ
дёҠиҝ°е°ұжҳҜе°Ҹзј–дёәеӨ§е®¶еҲҶдә«зҡ„д»Җд№ҲжҳҜзӣ‘жҺ§е·Ҙе…·Linux iotopдәҶпјҢеҰӮжһңеҲҡеҘҪжңүзұ»дјјзҡ„з–‘жғ‘пјҢдёҚеҰЁеҸӮз…§дёҠиҝ°еҲҶжһҗиҝӣиЎҢзҗҶи§ЈгҖӮеҰӮжһңжғізҹҘйҒ“жӣҙеӨҡзӣёе…ізҹҘиҜҶпјҢж¬ўиҝҺе…іжіЁдәҝйҖҹдә‘иЎҢдёҡиө„и®Ҝйў‘йҒ“гҖӮ


