本篇文章给大家分享的是有关Python中怎么构建一个决策树,小编觉得挺实用的,因此分享给大家学习,希望大家阅读完这篇文章后可以有所收获,话不多说,跟着小编一起来看看吧。
决策树
决策树是当今最强大的监督学习方法的组成部分。决策树基本上是一个二叉树的流程图,其中每个节点根据某个特征变量将一组观测值拆分。
决策树的目标是将数据分成多个组,这样一个组中的每个元素都属于同一个类别。决策树也可以用来近似连续的目标变量。在这种情况下,树将进行拆分,使每个组的均方误差最小。
决策树的一个重要特性是它们很容易被解释。你根本不需要熟悉机器学习技术就可以理解决策树在做什么。决策树图很容易解释。
利弊
决策树方法的优点是:
决策树能够生成可理解的规则。
决策树在不需要大量计算的情况下进行分类。
决策树能够处理连续变量和分类变量。
决策树提供了一个明确的指示,哪些字段是最重要的。
决策树方法的缺点是:
决策树不太适合于目标是预测连续属性值的估计任务。
决策树在类多、训练样本少的分类问题中容易出错。
决策树的训练在计算上可能很昂贵。生成决策树的过程在计算上非常昂贵。在每个节点上,每个候选拆分字段都必须进行排序,才能找到其最佳拆分。在某些算法中,使用字段组合,必须搜索最佳组合权重。剪枝算法也可能是昂贵的,因为许多候选子树必须形成和比较。
Python决策树
Python是一种通用编程语言,它为数据科学家提供了强大的机器学习包和工具。在本文中,我们将使用python最著名的机器学习包scikit-learn来构建决策树模型。我们将使用scikit learn提供的“DecisionTreeClassifier”算法创建模型,然后使用“plot_tree”函数可视化模型。
步骤1:导入包
我们构建模型的主要软件包是pandas、scikit learn和NumPy。按照代码在python中导入所需的包。
import pandas as pd # 数据处理 import numpy as np # 使用数组 import matplotlib.pyplot as plt # 可视化 from matplotlib import rcParams # 图大小 from termcolor import colored as cl # 文本自定义 from sklearn.tree import DecisionTreeClassifier as dtc # 树算法 from sklearn.model_selection import train_test_split # 拆分数据 from sklearn.metrics import accuracy_score # 模型准确度 from sklearn.tree import plot_tree # 树图 rcParams['figure.figsize'] = (25, 20)
在导入构建我们的模型所需的所有包之后,是时候导入数据并对其进行一些EDA了。
步骤2:导入数据和EDA
在这一步中,我们将使用python中提供的“Pandas”包来导入并在其上进行一些EDA。我们将建立我们的决策树模型,数据集是一个药物数据集,它是基于特定的标准给病人开的处方。让我们用python导入数据!
Python实现:
df = pd.read_csv('drug.csv') df.drop('Unnamed: 0', axis = 1, inplace = True) print(cl(df.head(), attrs = ['bold']))输出:
Age Sex BP Cholesterol Na_to_K Drug 0 23 F HIGH HIGH 25.355 drugY 1 47 M LOW HIGH 13.093 drugC 2 47 M LOW HIGH 10.114 drugC 3 28 F NORMAL HIGH 7.798 drugX 4 61 F LOW HIGH 18.043 drugY
现在我们对数据集有了一个清晰的概念。导入数据后,让我们使用“info”函数获取有关数据的一些基本信息。此函数提供的信息包括条目数、索引号、列名、非空值计数、属性类型等。
Python实现:
df.info()
输出:
<class 'pandas.core.frame.DataFrame'> RangeIndex: 200 entries, 0 to 199 Data columns (total 6 columns): # Column Non-Null Count Dtype --- ------ -------------- ----- 0 Age 200 non-null int64 1 Sex 200 non-null object 2 BP 200 non-null object 3 Cholesterol 200 non-null object 4 Na_to_K 200 non-null float64 5 Drug 200 non-null object dtypes: float64(1), int64(1), object(4) memory usage: 9.5+ KB
步骤3:数据处理
我们可以看到像Sex, BP和Cholesterol这样的属性在本质上是分类的和对象类型的。问题是,scikit-learn中的决策树算法本质上不支持X变量(特征)是“对象”类型。因此,有必要将这些“object”值转换为“binary”值。让我们用python来实现
Python实现:
for i in df.Sex.values: if i == 'M': df.Sex.replace(i, 0, inplace = True) else: df.Sex.replace(i, 1, inplace = True) for i in df.BP.values: if i == 'LOW': df.BP.replace(i, 0, inplace = True) elif i == 'NORMAL': df.BP.replace(i, 1, inplace = True) elif i == 'HIGH': df.BP.replace(i, 2, inplace = True) for i in df.Cholesterol.values: if i == 'LOW': df.Cholesterol.replace(i, 0, inplace = True) else: df.Cholesterol.replace(i, 1, inplace = True) print(cl(df, attrs = ['bold']))
输出:
Age Sex BP Cholesterol Na_to_K Drug 0 23 1 2 1 25.355 drugY 1 47 1 0 1 13.093 drugC 2 47 1 0 1 10.114 drugC 3 28 1 1 1 7.798 drugX 4 61 1 0 1 18.043 drugY .. ... ... .. ... ... ... 195 56 1 0 1 11.567 drugC 196 16 1 0 1 12.006 drugC 197 52 1 1 1 9.894 drugX 198 23 1 1 1 14.020 drugX 199 40 1 0 1 11.349 drugX [200 rows x 6 columns]
我们可以观察到所有的“object”值都被处理成“binary”值来表示分类数据。例如,在胆固醇属性中,显示“低”的值被处理为0,“高”则被处理为1。现在我们准备好从数据中创建因变量和自变量。
步骤4:拆分数据
在将我们的数据处理为正确的结构之后,我们现在设置“X”变量(自变量),“Y”变量(因变量)。让我们用python来实现
Python实现:
X_var = df[['Sex', 'BP', 'Age', 'Cholesterol', 'Na_to_K']].values # 自变量 y_var = df['Drug'].values # 因变量 print(cl('X variable samples : {}'.format(X_var[:5]), attrs = ['bold'])) print(cl('Y variable samples : {}'.format(y_var[:5]), attrs = ['bold']))输出:
X variable samples : [[ 1. 2. 23. 1. 25.355] [ 1. 0. 47. 1. 13.093] [ 1. 0. 47. 1. 10.114] [ 1. 1. 28. 1. 7.798] [ 1. 0. 61. 1. 18.043]] Y variable samples : ['drugY' 'drugC' 'drugC' 'drugX' 'drugY']
我们现在可以使用scikit learn中的“train_test_split”算法将数据分成训练集和测试集,其中包含我们定义的X和Y变量。按照代码在python中拆分数据。
Python实现:
X_train, X_test, y_train, y_test = train_test_split(X_var, y_var, test_size = 0.2, random_state = 0) print(cl('X_train shape : {}'.format(X_train.shape), attrs = ['bold'], color = 'black')) print(cl('X_test shape : {}'.format(X_test.shape), attrs = ['bold'], color = 'black')) print(cl('y_train shape : {}'.format(y_train.shape), attrs = ['bold'], color = 'black')) print(cl('y_test shape : {}'.format(y_test.shape), attrs = ['bold'], color = 'black'))输出:
X_train shape : (160, 5) X_test shape : (40, 5) y_train shape : (160,) y_test shape : (40,)
现在我们有了构建决策树模型的所有组件。所以,让我们继续用python构建我们的模型。
步骤5:建立模型和预测
在scikit学习包提供的“DecisionTreeClassifier”算法的帮助下,构建决策树是可行的。之后,我们可以使用我们训练过的模型来预测我们的数据。最后,我们的预测结果的精度可以用“准确度”评估指标来计算。让我们用python来完成这个过程!
Python实现:
model = dtc(criterion = 'entropy', max_depth = 4) model.fit(X_train, y_train) pred_model = model.predict(X_test) print(cl('Accuracy of the model is {:.0%}'.format(accuracy_score(y_test, pred_model)), attrs = ['bold']))输出:
Accuracy of the model is 88%
在代码的第一步中,我们定义了一个名为“model”变量的变量,我们在其中存储DecisionTreeClassifier模型。接下来,我们将使用我们的训练集对模型进行拟合和训练。之后,我们定义了一个变量,称为“pred_model”变量,其中我们将模型预测的所有值存储在数据上。最后,我们计算了我们的预测值与实际值的精度,其准确率为88%。
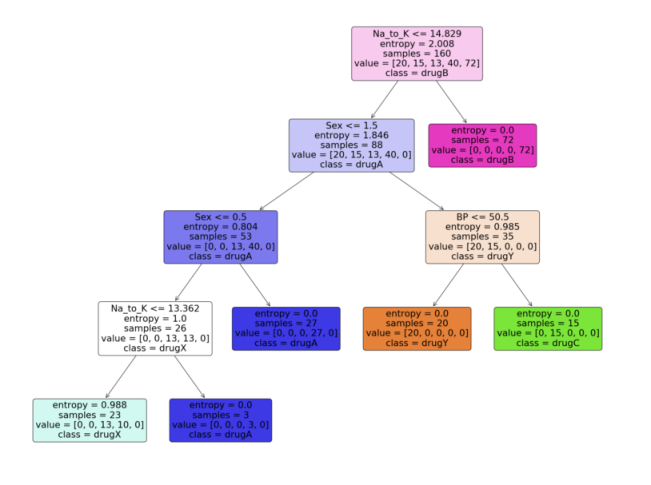
步骤6:可视化模型
现在我们有了决策树模型,让我们利用python中scikit learn包提供的“plot_tree”函数来可视化它。按照代码从python中的决策树模型生成一个漂亮的树图。
Python实现:
feature_names = df.columns[:5] target_names = df['Drug'].unique().tolist() plot_tree(model, feature_names = feature_names, class_names = target_names, filled = True, rounded = True) plt.savefig('tree_visualization.png')输出:
结论
有很多技术和其他算法用于优化决策树和避免过拟合,比如剪枝。虽然决策树通常是不稳定的,这意味着数据的微小变化会导致最优树结构的巨大变化,但其简单性使其成为广泛应用的有力候选。在神经网络流行之前,决策树是机器学习中最先进的算法。其他一些集成模型,比如随机森林模型,比普通决策树模型更强大。
决策树由于其简单性和可解释性而非常强大。决策树和随机森林在用户注册建模、信用评分、故障预测、医疗诊断等领域有着广泛的应用。我为本文提供了完整的代码。
完整代码:
import pandas as pd # 数据处理 import numpy as np # 使用数组 import matplotlib.pyplot as plt # 可视化 from matplotlib import rcParams # 图大小 from termcolor import colored as cl # 文本自定义 from sklearn.tree import DecisionTreeClassifier as dtc # 树算法 from sklearn.model_selection import train_test_split # 拆分数据 from sklearn.metrics import accuracy_score # 模型准确度 from sklearn.tree import plot_tree # 树图 rcParams['figure.figsize'] = (25, 20) df = pd.read_csv('drug.csv') df.drop('Unnamed: 0', axis = 1, inplace = True) print(cl(df.head(), attrs = ['bold'])) df.info() for i in df.Sex.values: if i == 'M': df.Sex.replace(i, 0, inplace = True) else: df.Sex.replace(i, 1, inplace = True) for i in df.BP.values: if i == 'LOW': df.BP.replace(i, 0, inplace = True) elif i == 'NORMAL': df.BP.replace(i, 1, inplace = True) elif i == 'HIGH': df.BP.replace(i, 2, inplace = True) for i in df.Cholesterol.values: if i == 'LOW': df.Cholesterol.replace(i, 0, inplace = True) else: df.Cholesterol.replace(i, 1, inplace = True) print(cl(df, attrs = ['bold'])) X_var = df[['Sex', 'BP', 'Age', 'Cholesterol', 'Na_to_K']].values # 自变量 y_var = df['Drug'].values # 因变量 print(cl('X variable samples : {}'.format(X_var[:5]), attrs = ['bold'])) print(cl('Y variable samples : {}'.format(y_var[:5]), attrs = ['bold'])) X_train, X_test, y_train, y_test = train_test_split(X_var, y_var, test_size = 0.2, random_state = 0) print(cl('X_train shape : {}'.format(X_train.shape), attrs = ['bold'], color = 'red')) print(cl('X_test shape : {}'.format(X_test.shape), attrs = ['bold'], color = 'red')) print(cl('y_train shape : {}'.format(y_train.shape), attrs = ['bold'], color = 'green')) print(cl('y_test shape : {}'.format(y_test.shape), attrs = ['bold'], color = 'green')) model = dtc(criterion = 'entropy', max_depth = 4) model.fit(X_train, y_train) pred_model = model.predict(X_test) print(cl('Accuracy of the model is {:.0%}'.format(accuracy_score(y_test, pred_model)), attrs = ['bold'])) feature_names = df.columns[:5] target_names = df['Drug'].unique().tolist() plot_tree(model, feature_names = feature_names, class_names = target_names, filled = True, rounded = True) plt.savefig('tree_visualization.png')以上就是Python中怎么构建一个决策树,小编相信有部分知识点可能是我们日常工作会见到或用到的。希望你能通过这篇文章学到更多知识。更多详情敬请关注亿速云行业资讯频道。
免责声明:本站发布的内容(图片、视频和文字)以原创、转载和分享为主,文章观点不代表本网站立场,如果涉及侵权请联系站长邮箱:is@yisu.com进行举报,并提供相关证据,一经查实,将立刻删除涉嫌侵权内容。


