这篇文章主要讲解了“如何使用tensorboard展示神经网络的graph”,文中的讲解内容简单清晰,易于学习与理解,下面请大家跟着小编的思路慢慢深入,一起来研究和学习“如何使用tensorboard展示神经网络的graph”吧!
# 创建神经网络, 使用tensorboard 展示graph
import tensorflow as tf
import numpy as np
import matplotlib.pyplot as plt # 若没有 pip install matplotlib
# 定义一个神经层
def add_layer(inputs, in_size, out_size, activation_function=None):
#add one more layer and return the output of this layer
with tf.name_scope('layer'):
with tf.name_scope('Weights'):
Weights = tf.Variable(tf.random_normal([in_size, out_size]),name='W')
with tf.name_scope('biases'):
biases = tf.Variable(tf.zeros([1, out_size]) + 0.1,name='b')
with tf.name_scope('Wx_plus_b'):
Wx_plus_b = tf.matmul(inputs, Weights) + biases
if activation_function is None:
outputs = Wx_plus_b
else:
outputs = activation_function(Wx_plus_b)###
return outputs
#make up some real data
x_data = np.linspace(-1, 1, 300)[:, np.newaxis] # x_data值为-1到1之间,有300个单位(例子),再加一个维度newaxis,即300行*newaxis列
noise = np.random.normal(0, 0.05, x_data.shape) # 均值为0.方差为0.05,格式和x_data一样
y_data = np.square(x_data) - 0.5 + noise
#define placeholder for inputs to network
with tf.name_scope('inputs'):
xs = tf.placeholder(tf.float32, [None, 1],name='x_input1') # none表示无论给多少个例子都行
ys = tf.placeholder(tf.float32, [None, 1],name='y_input1')
# add hidden layer
l1 = add_layer(xs, 1, 10, activation_function=tf.nn.relu)
# add output layer
prediction = add_layer(l1, 10, 1, activation_function=None)
#the error between prediction and real data
with tf.name_scope('loss'):
loss = tf.reduce_mean(
tf.reduce_sum(tf.square(ys - prediction), reduction_indices=[1])) # 对每个例子进行求和并取平均值 reduction_indices=[1]指按行求和
with tf.name_scope('train'):
train_step = tf.train.GradientDescentOptimizer(0.1).minimize(loss) # 以0.1的学习效率对误差进行更正和提升
#两种初始化的方式
#init = tf.initialize_all_variables()
init = tf.global_variables_initializer()
sess = tf.Session()
sess.run(init)
#把整个框架加载到一个文件中去,再从文件中加载出来放到浏览器中查看
#writer=tf.train.SummaryWriter("logs/",sess.graph)
#首先找到tensorboard.exe的路径并进入c:Anaconda\Scripts,执行tensorboard.exe --logdir=代码生成的图像的路径(不能带中文)
writer=tf.summary.FileWriter("../../logs/",sess.graph)
fig = plt.figure()
ax = fig.add_subplot(1, 1, 1)
ax.scatter(x_data, y_data)
plt.ion()
plt.show() #show()是一次性的展示,为了使连续的展示,加入plt.ion()
for i in range(1000):
sess.run(train_step, feed_dict={xs: x_data, ys: y_data})
if i % 50 == 0:
# to see the step improment 显示实际点的数据
# print(sess.run(loss,feed_dict = {xs:x_data,ys:y_data}))
try:
# 每次划线前抹除上一条线,抹除lines的第一条线,由于lines只有一条线,则为lines[0],第一次没有线
ax.lines.remove(lines[0])
except Exception:
pass
# 显示预测数据
prediction_value = sess.run(prediction, feed_dict={xs: x_data})
# 存储 prediction_value 的值
lines = ax.plot(x_data, prediction_value, 'r-', lw=5) # 用红色的线画,且宽度为5
# 停止0.1秒后再画下一条线
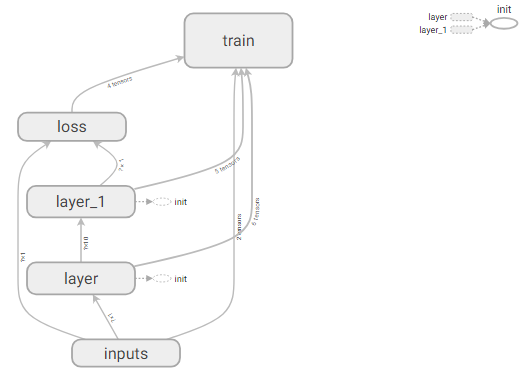
plt.pause(0.1)生成的tensorboard的graph:
感谢各位的阅读,以上就是“如何使用tensorboard展示神经网络的graph”的内容了,经过本文的学习后,相信大家对如何使用tensorboard展示神经网络的graph这一问题有了更深刻的体会,具体使用情况还需要大家实践验证。这里是亿速云,小编将为大家推送更多相关知识点的文章,欢迎关注!
免责声明:本站发布的内容(图片、视频和文字)以原创、转载和分享为主,文章观点不代表本网站立场,如果涉及侵权请联系站长邮箱:is@yisu.com进行举报,并提供相关证据,一经查实,将立刻删除涉嫌侵权内容。


