本篇内容介绍了“Python爬虫入门案例之实现爬取二手房源数据”的有关知识,在实际案例的操作过程中,不少人都会遇到这样的困境,接下来就让小编带领大家学习一下如何处理这些情况吧!希望大家仔细阅读,能够学有所成!
系统分析网页性质
结构化的数据解析
csv数据保存
python 3.8
pycharm 专业版 >>> 激活码
#模块使用
requests >>> pip install requests
parsel >>> pip install parsel
csv
【付费VIP完整版】只要看了就能学会的教程,80集Python基础入门视频教学
点这里即可免费在线观看
爬虫代码实现步骤: 发送请求 >>> 获取数据 >>> 解析数据 >>> 保存数据
import requests # 数据请求模块 第三方模块 pip install requests
import parsel # 数据解析模块
import re
import csv
url = 'https://bj.lianjia.com/ershoufang/pg1/'
# 需要携带上 请求头: 把python代码伪装成浏览器 对于服务器发送请求
# User-Agent 浏览器的基本信息
headers = {
    'User-Agent': 'Mozilla/5.0 (Windows NT 10.0; Win64; x64) AppleWebKit/537.36 (KHTML, like Gecko) Chrome/94.0.4606.61 Safari/537.36'
}
response = requests.get(url=url, headers=headers)
print(response.text)
selector_1 = parsel.Selector(response.text)
# 把获取到response.text 数据内容转成 selector 对象
href = selector_1.css('div.leftContent li div.title a::attr(href)').getall()
for link in href:
    html_data = requests.get(url=link, headers=headers).text
    selector = parsel.Selector(html_data)
    # css选择器 语法
    # try:
    title = selector.css('.title h2::text').get() # 标题
    area = selector.css('.areaName .info a:nth-child(1)::text').get()  # 区域
    community_name = selector.css('.communityName .info::text').get()  # 小区
    room = selector.css('.room .mainInfo::text').get()  # 户型
    room_type = selector.css('.type .mainInfo::text').get()  # 朝向
    height = selector.css('.room .subInfo::text').get().split('/')[-1]  # 楼层
    # 中楼层/共5层 split('/') 进行字符串分割  ['中楼层', '共5层'] [-1]
    # ['中楼层', '共5层'][-1] 列表索引位置取值 取列表中最后一个元素  共5层
    # re.findall('共(\d+)层', 共5层) >>>  [5][0] >>> 5
    height = re.findall('共(\d+)层', height)[0]
    sub_info = selector.css('.type .subInfo::text').get().split('/')[-1]  # 装修
    Elevator = selector.css('.content li:nth-child(12)::text').get()  # 电梯
    # if Elevator == '暂无数据电梯' or Elevator == None:
    #     Elevator = '无电梯'
    house_area = selector.css('.content li:nth-child(3)::text').get().replace('㎡', '')  # 面积
    price = selector.css('.price .total::text').get()  # 价格(万元)
    date = selector.css('.area .subInfo::text').get().replace('年建', '')  # 年份
    dit = {
        '标题': title,
        '市区': area,
        '小区': community_name,
        '户型': room,
        '朝向': room_type,
        '楼层': height,
        '装修情况': sub_info,
        '电梯': Elevator,
        '面积(㎡)': house_area,
        '价格(万元)': price,
        '年份': date,
    }
    csv_writer.writerow(dit)
    print(title, area, community_name, room, room_type, height, sub_info, Elevator, house_area, price, date,
sep='|')f = open('二手房数据.csv', mode='a', encoding='utf-8', newline='')
csv_writer = csv.DictWriter(f, fieldnames=[
'标题',
'市区',
'小区',
'户型',
'朝向',
'楼层',
'装修情况',
'电梯',
'面积(㎡)',
'价格(万元)',
'年份',
])
csv_writer.writeheader()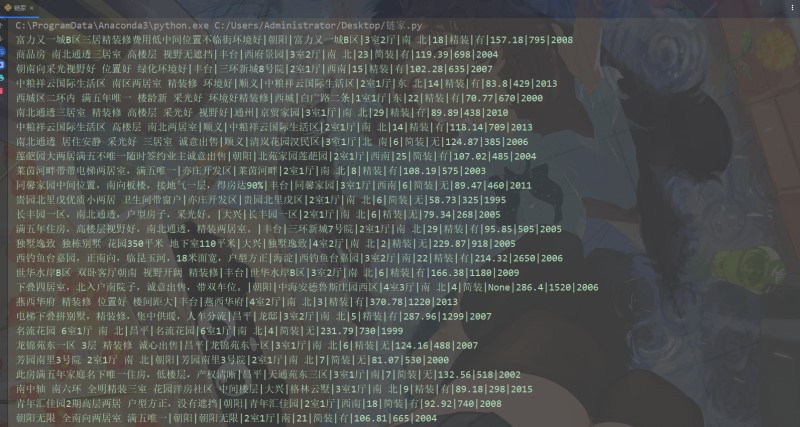
import pandas as pd
from pyecharts.charts import Map
from pyecharts.charts import Bar
from pyecharts.charts import Line
from pyecharts.charts import Grid
from pyecharts.charts import Pie
from pyecharts.charts import Scatter
from pyecharts import options as opts
df = pd.read_csv('链家.csv', encoding = 'utf-8')
df.head()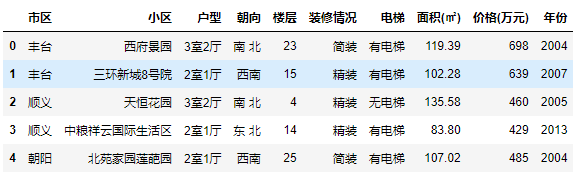
new = [x + '区' for x in region]
m = (
        Map()
        .add('', [list(z) for z in zip(new, count)], '北京')
        .set_global_opts(
            title_opts=opts.TitleOpts(title='北京市二手房各区分布'),
            visualmap_opts=opts.VisualMapOpts(max_=3000),
        )
    )
m.render_notebook()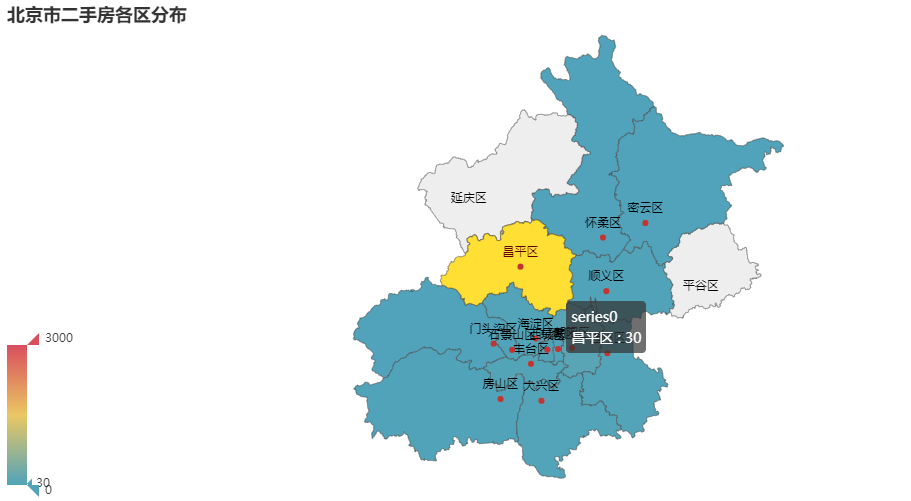
df_price.values.tolist()
price = [round(x,2) for x in df_price.values.tolist()]
bar = (
    Bar()
    .add_xaxis(region)
    .add_yaxis('数量', count,
              label_opts=opts.LabelOpts(is_show=True))
    .extend_axis(
        yaxis=opts.AxisOpts(
            name="价格(万元)",
            type_="value",
            min_=200,
            max_=900,
            interval=100,
            axislabel_opts=opts.LabelOpts(formatter="{value}"),
        )
    )
    .set_global_opts(
        title_opts=opts.TitleOpts(title='各城区二手房数量-平均价格柱状图'),
        tooltip_opts=opts.TooltipOpts(
            is_show=True, trigger="axis", axis_pointer_type="cross"
        ),
        xaxis_opts=opts.AxisOpts(
            type_="category",
            axispointer_opts=opts.AxisPointerOpts(is_show=True, type_="shadow"),
        ),
        yaxis_opts=opts.AxisOpts(name='数量',
            axistick_opts=opts.AxisTickOpts(is_show=True),
            splitline_opts=opts.SplitLineOpts(is_show=False),)
    )
)

line2 = (
    Line()
    .add_xaxis(xaxis_data=region)
    .add_yaxis(

        series_name="价格",
        yaxis_index=1,
        y_axis=price,
        label_opts=opts.LabelOpts(is_show=True),
        z=10
        )
)

bar.overlap(line2)
grid = Grid()
grid.add(bar, opts.GridOpts(pos_left="5%", pos_right="20%"), is_control_axis_index=True)
grid.render_notebook()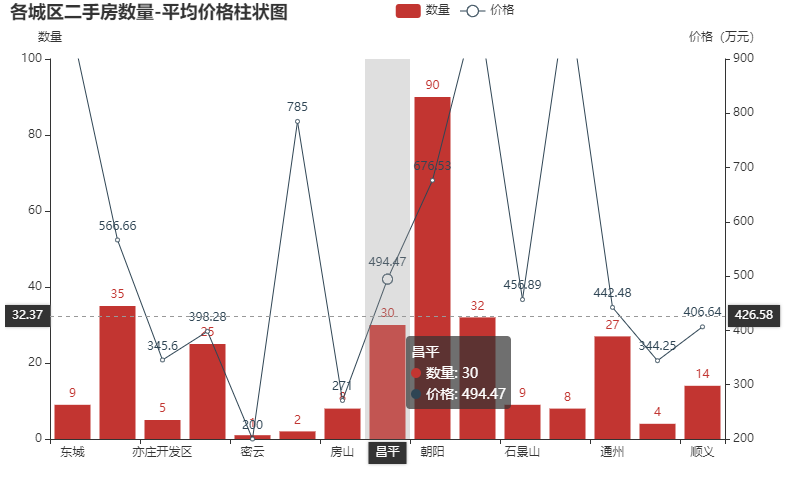
area0 = top_price['小区'].values.tolist()
count = top_price['价格(万元)'].values.tolist()

bar = (
    Bar()
    .add_xaxis(area0)
    .add_yaxis('数量', count,category_gap = '50%')
    .set_global_opts(
        yaxis_opts=opts.AxisOpts(name='价格(万元)'),
        xaxis_opts=opts.AxisOpts(name='数量'),
    )
)
bar.render_notebook()
s = (
    Scatter()
    .add_xaxis(df['面积(㎡)'].values.tolist())
    .add_yaxis('',df['价格(万元)'].values.tolist())
    .set_global_opts(xaxis_opts=opts.AxisOpts(type_='value'))
)
s.render_notebook()
directions = df_direction.index.tolist()
count = df_direction.values.tolist()

c1 = (
    Pie(init_opts=opts.InitOpts(
            width='800px', height='600px',
            )
       )
        .add(
        '',
        [list(z) for z in zip(directions, count)],
        radius=['20%', '60%'],
        center=['40%', '50%'],
#         rosetype="radius",
        label_opts=opts.LabelOpts(is_show=True),
        )
        .set_global_opts(title_opts=opts.TitleOpts(title='房屋朝向占比',pos_left='33%',pos_top="5%"),
                        legend_opts=opts.LegendOpts(type_="scroll", pos_left="80%",pos_top="25%",orient="vertical")
                        )
        .set_series_opts(label_opts=opts.LabelOpts(formatter='{b}:{c} ({d}%)'),position="outside")
    )
c1.render_notebook()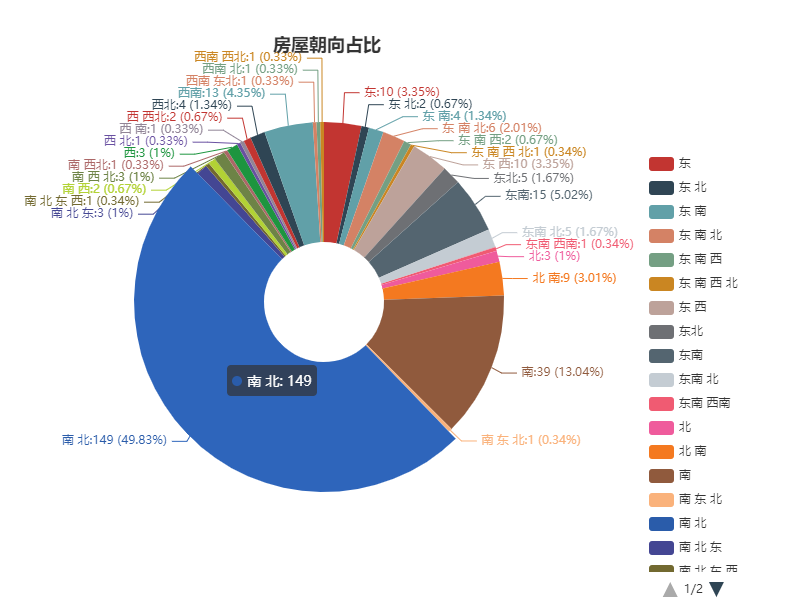
fitment = df_fitment.index.tolist()
count1 = df_fitment.values.tolist()

directions = df_direction.index.tolist()
count2 = df_direction.values.tolist()

bar = (
    Bar()
    .add_xaxis(fitment)
    .add_yaxis('', count1, category_gap = '50%')
    .reversal_axis()
    .set_series_opts(label_opts=opts.LabelOpts(position='right'))
    .set_global_opts(
        xaxis_opts=opts.AxisOpts(name='数量'),
        title_opts=opts.TitleOpts(title='装修情况/有无电梯玫瑰图(组合图)',pos_left='33%',pos_top="5%"),
        legend_opts=opts.LegendOpts(type_="scroll", pos_left="90%",pos_top="58%",orient="vertical")
    )
)

c2 = (
    Pie(init_opts=opts.InitOpts(
            width='800px', height='600px',
            )
       )
        .add(
        '',
        [list(z) for z in zip(directions, count2)],
        radius=['10%', '30%'],
        center=['75%', '65%'],
        rosetype="radius",
        label_opts=opts.LabelOpts(is_show=True),
        )
        .set_global_opts(title_opts=opts.TitleOpts(title='有/无电梯',pos_left='33%',pos_top="5%"),
                        legend_opts=opts.LegendOpts(type_="scroll", pos_left="90%",pos_top="15%",orient="vertical")
                        )
        .set_series_opts(label_opts=opts.LabelOpts(formatter='{b}:{c} \n ({d}%)'),position="outside")
    )

bar.overlap(c2)
bar.render_notebook()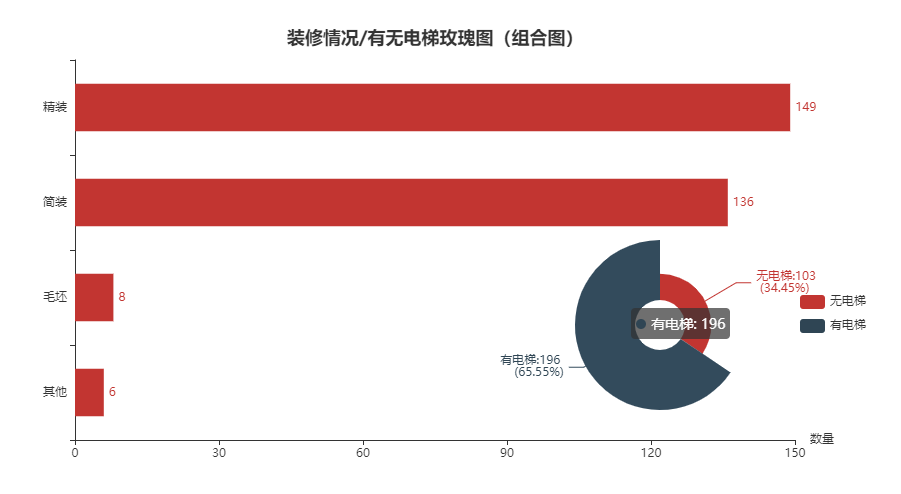
floor = df_floor.index.tolist()
count = df_floor.values.tolist()
bar = (
    Bar()
    .add_xaxis(floor)
    .add_yaxis('数量', count)
    .set_global_opts(
        title_opts=opts.TitleOpts(title='二手房楼层分布柱状缩放图'),
        yaxis_opts=opts.AxisOpts(name='数量'),
        xaxis_opts=opts.AxisOpts(name='楼层'),
        datazoom_opts=opts.DataZoomOpts(type_='slider')
    )
)
bar.render_notebook()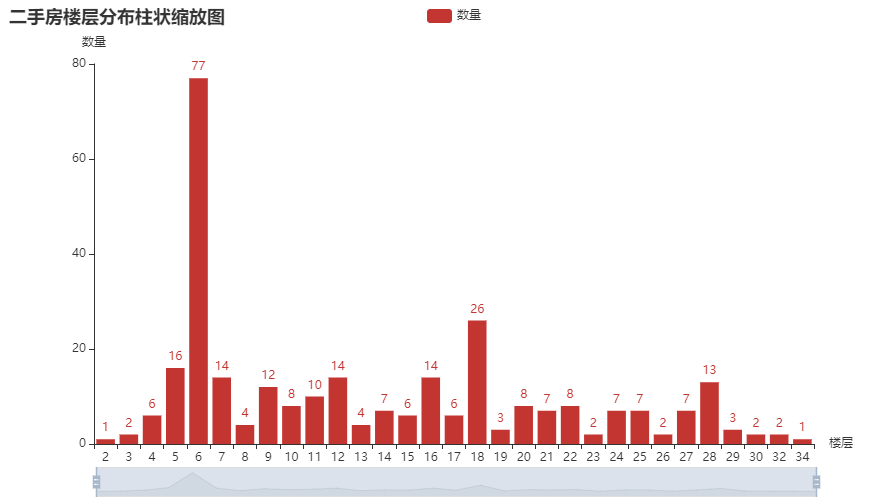
area = df_area.index.tolist()
count = df_area.values.tolist()

bar = (
    Bar()
    .add_xaxis(area)
    .add_yaxis('数量', count)
    .reversal_axis()
    .set_series_opts(label_opts=opts.LabelOpts(position="right"))
    .set_global_opts(
        title_opts=opts.TitleOpts(title='房屋面积分布纵向柱状图'),
        yaxis_opts=opts.AxisOpts(name='面积(㎡)'),
        xaxis_opts=opts.AxisOpts(name='数量'),
    )
)
bar.render_notebook()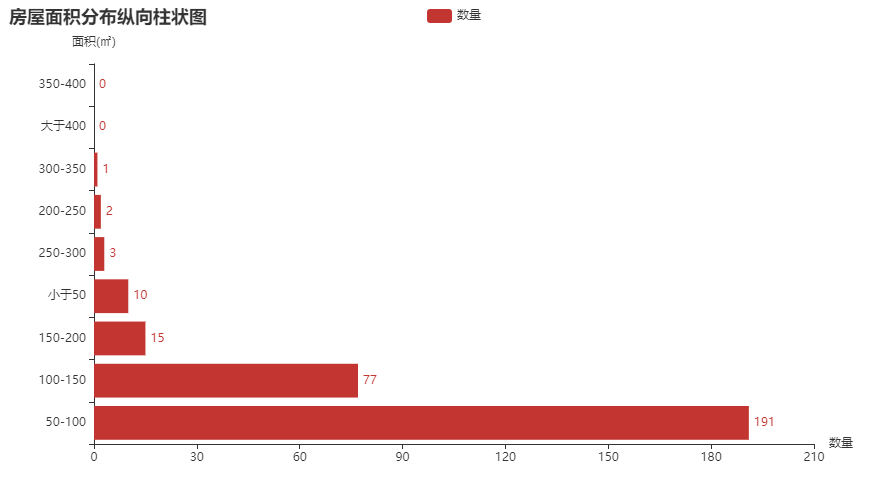
“Python爬虫入门案例之实现爬取二手房源数据”的内容就介绍到这里了,感谢大家的阅读。如果想了解更多行业相关的知识可以关注亿速云网站,小编将为大家输出更多高质量的实用文章!
免责声明:本站发布的内容(图片、视频和文字)以原创、转载和分享为主,文章观点不代表本网站立场,如果涉及侵权请联系站长邮箱:is@yisu.com进行举报,并提供相关证据,一经查实,将立刻删除涉嫌侵权内容。


