这篇文章主要介绍Python+matplotlib如何实现饼图的绘制,文中介绍的非常详细,具有一定的参考价值,感兴趣的小伙伴们一定要看完!
关于cnboo1.xlsx,我放在我的码云里,需要的朋友自行下载:cnboo1.xlsx
films=['穿过寒冬拥抱你','反贪风暴5:最终章','李茂扮太子','误杀2','以年为单位的恋爱','黑客帝国:矩阵重启','雄狮少年','魔法满屋','汪汪队立大功大电影','爱情神话']
regions=['中国','英国','澳大利亚','美国','美国','中国','英国','澳大利亚','美国','美国']
bos=['61,181','44,303','42,439','22,984','13,979','61,181','44,303','41,439','20,984','19,979']
persons=['31','23','56','17','9','31','23','56','17','9']
prices=['51','43','56','57','49','51','43','56','57','49']
showdate=['2022-12-03','2022-12-05','2022-12-01','2022-12-02','2022-11-05','2022-12-03','2022-12-05','2022-12-01','2022-12-02','2022-11-05']
ftypes=['剧情','动作','喜剧','剧情','剧情','爱情','动作','动画','动画','动画']
points=['8.1','9.0','7.9','6.7','3.8','8.1','9.0','7.9','6.7','3.8']
filmdescript={
    'ftypes':ftypes,
    'bos':bos,
    'prices':prices,
    'persons':persons,
    'regions':regions,
    'showdate':showdate,
    'points':points
}
import numpy as np
import pandas as pd
cnbo2021top5=pd.DataFrame(filmdescript,index=films)
cnbo2021top5[['prices','persons']]=cnbo2021top5[['prices','persons']].astype(int)
cnbo2021top5['bos']=cnbo2021top5['bos'].str.replace(',','').astype(int)
cnbo2021top5['showdate']=cnbo2021top5['showdate'].astype('datetime64')
cnbo2021top5['points']=cnbo2021top5['points'].apply(lambda x:float(x) if x!='' else 0)
import pandas as pd
cnbodf=pd.read_excel('cnboo1.xlsx')
cnbodfsort=cnbodf.sort_values(by=['BO'],ascending=False)
cnbodfsort.index=cnbodfsort.TYPE
bo=cnbo2021top5.bos.sort_values()def mkpoints(x,y): return len(str(x))*(y/25)-3 cnbodfsort['points']=cnbodfsort.apply(lambda x:mkpoints(x.BO,x.PERSONS),axis=1)
cnbodfsort['type1']=cnbodfsort['TYPE'].apply(lambda x:x.split("/")[0])
cnbodfgb=cnbodfsort.groupby(["type1"])["ID","BO","PRICE","PERSONS","points"].mean()
cnbodfgbsort=cnbodfgb.sort_values("BO",ascending=False)from matplotlib import pyplot as plt
plt.style.use('seaborn')
plt.figure(figsize=(15,9))
plt.rcParams.update({'font.family': "Microsoft YaHei"})
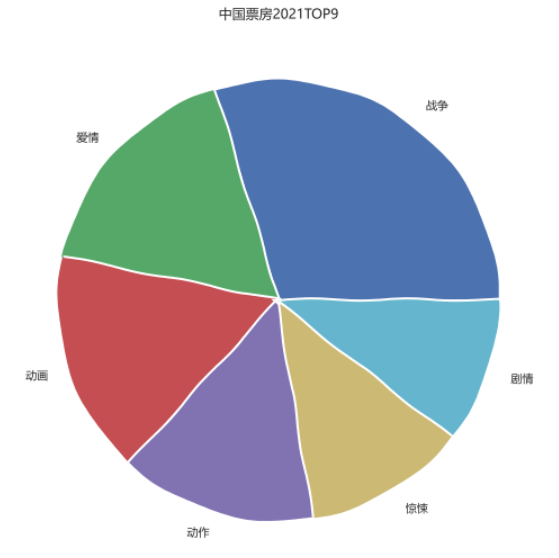
plt.title("中国票房2021TOP9")
plt.pie(cnbodfgbsort.BO,labels=cnbodfgbsort.index)
plt.show()这里涉及到简历的漫画效果:详情请访问:为图表添加漫画效果
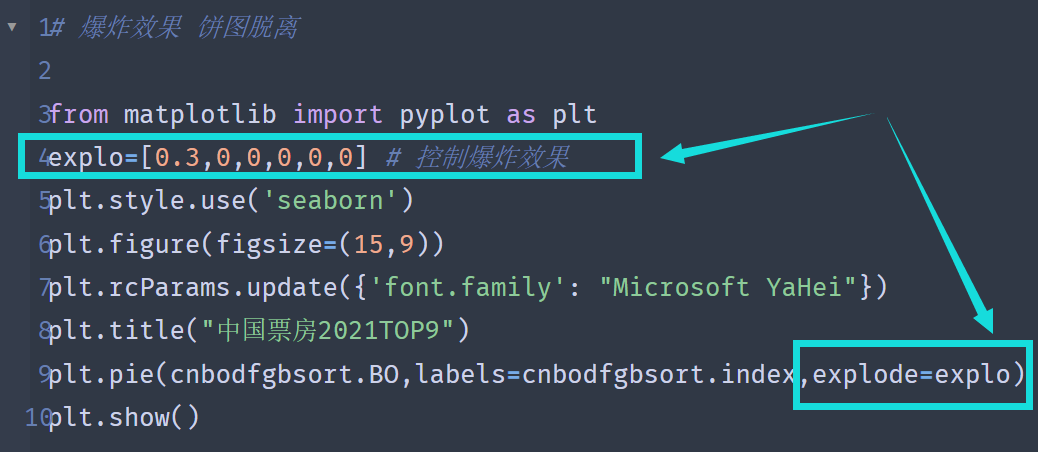
# 爆炸效果 饼图脱离

from matplotlib import pyplot as plt
explo=[0.3,0,0,0,0,0] # 控制爆炸效果,通过更改参数控制距离的长短
plt.style.use('seaborn')
plt.figure(figsize=(15,9))
plt.rcParams.update({'font.family': "Microsoft YaHei"})
plt.title("中国票房2021TOP9")
plt.pie(cnbodfgbsort.BO,labels=cnbodfgbsort.index,explode=explo)
plt.show()
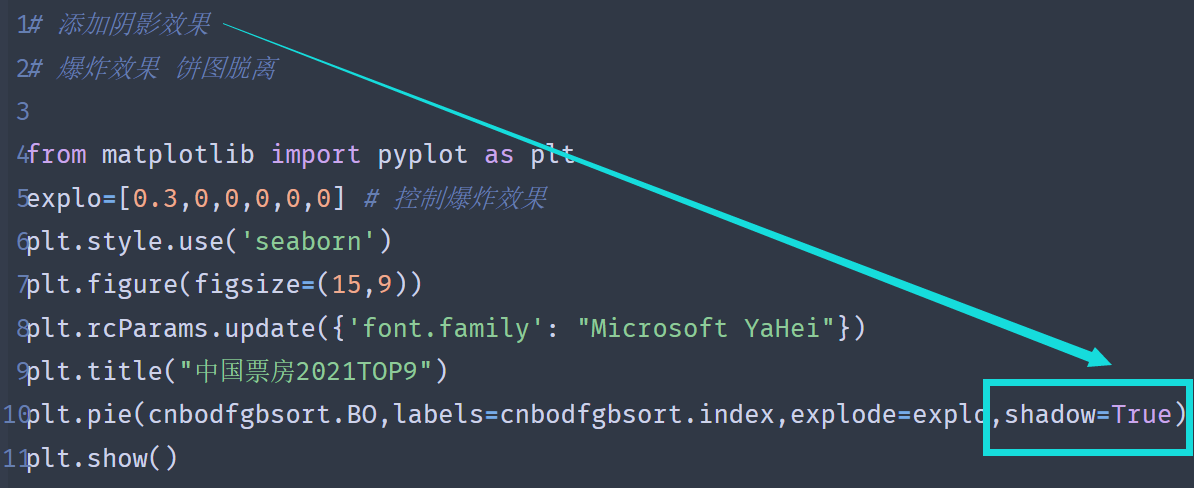
# 添加阴影效果
# 爆炸效果 饼图脱离

from matplotlib import pyplot as plt
explo=[0.3,0,0,0,0,0] # 控制爆炸效果
plt.style.use('seaborn')
plt.figure(figsize=(15,9))
plt.rcParams.update({'font.family': "Microsoft YaHei"})
plt.title("中国票房2021TOP9")
plt.pie(cnbodfgbsort.BO,labels=cnbodfgbsort.index,explode=explo,shadow=True)
plt.show()
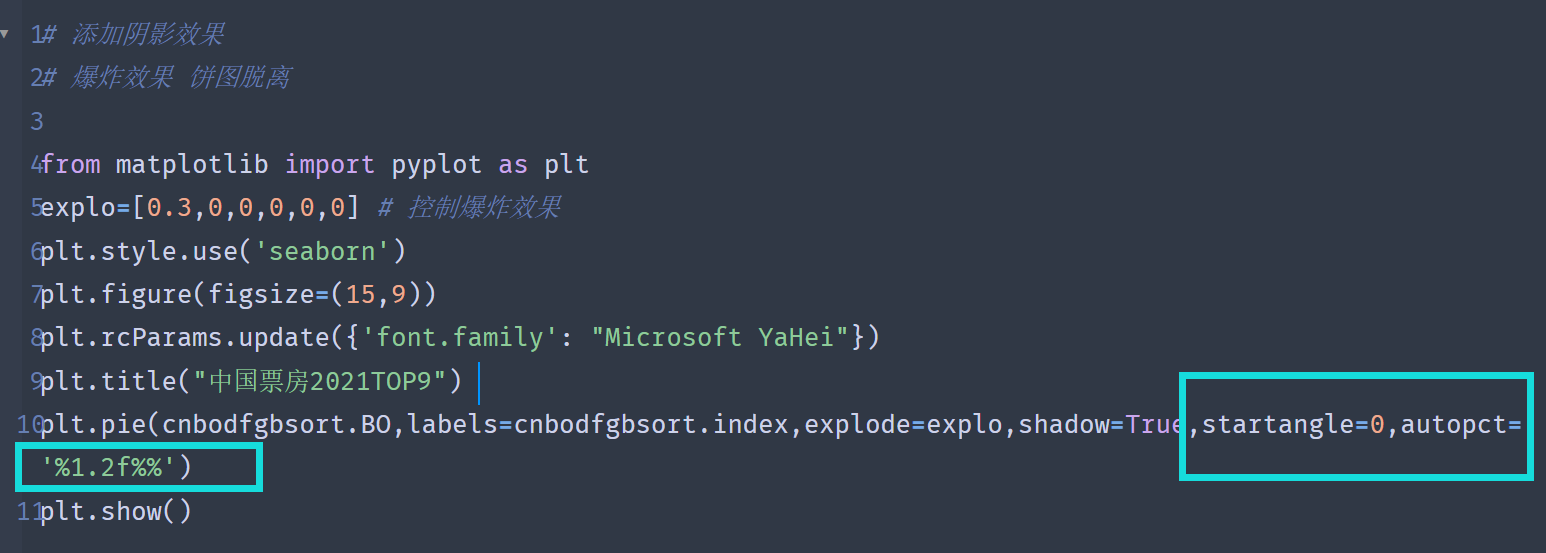
# 添加阴影效果
# 爆炸效果 饼图脱离

from matplotlib import pyplot as plt
explo=[0.3,0,0,0,0,0] # 控制爆炸效果
plt.style.use('seaborn')
plt.figure(figsize=(15,9))
plt.rcParams.update({'font.family': "Microsoft YaHei"})
plt.title("中国票房2021TOP9")
plt.pie(cnbodfgbsort.BO,labels=cnbodfgbsort.index,explode=explo,shadow=True,startangle=0,autopct='%1.2f%%')
plt.show()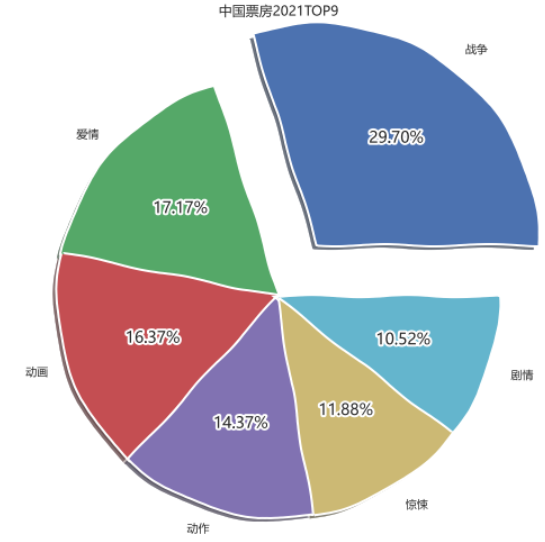
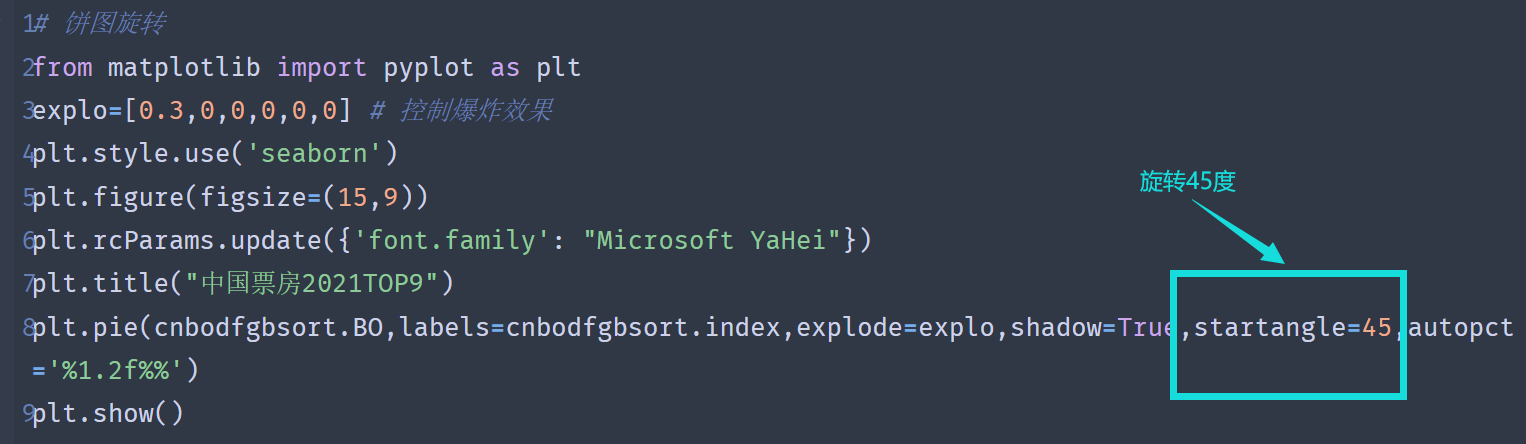
# 饼图旋转
from matplotlib import pyplot as plt
explo=[0.3,0,0,0,0,0] # 控制爆炸效果
plt.style.use('seaborn')
plt.figure(figsize=(15,9))
plt.rcParams.update({'font.family': "Microsoft YaHei"})
plt.title("中国票房2021TOP9")
plt.pie(cnbodfgbsort.BO,labels=cnbodfgbsort.index,explode=explo,shadow=True,startangle=45,autopct='%1.2f%%')
plt.show()
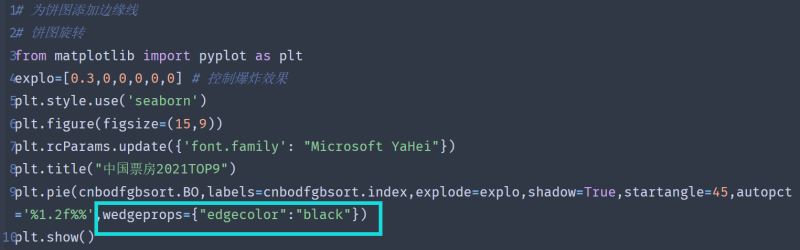
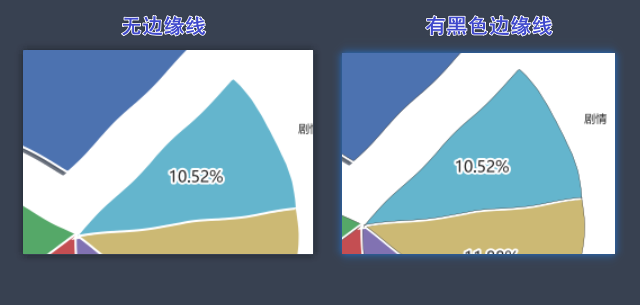
# 为饼图添加边缘线
from matplotlib import pyplot as plt
explo=[0.3,0,0,0,0,0] # 控制爆炸效果
plt.style.use('seaborn')
plt.figure(figsize=(15,9))
plt.rcParams.update({'font.family': "Microsoft YaHei"})
plt.title("中国票房2021TOP9")
plt.pie(cnbodfgbsort.BO,labels=cnbodfgbsort.index,explode=explo,shadow=True,startangle=45,autopct='%1.2f%%',wedgeprops={"edgecolor":"black"})
plt.show()
但是我自己感觉并不是非常明显

# 将数据按照票房分类
labels=['>20000','15000-20000','10000-15000','<10000']
c1=cnbodfsort.loc[cnbodfsort.BO>=20000].count()[0]
c2=cnbodfsort.loc[(cnbodfsort.BO>=15000) & (cnbodfsort.BO<20000)].count()[0]
c3=cnbodfsort.loc[(cnbodfsort.BO<15000) & (cnbodfsort.BO>=10000)].count()[0]
c4=cnbodfsort.loc[cnbodfsort.BO<10000].count()[0]
cnbohints=[c1,c2,c3,c4]
from matplotlib import pyplot as plt
explo=[0.3,0,0,0] # 控制爆炸效果
plt.style.use('seaborn')
plt.figure(figsize=(15,9))
plt.rcParams.update({'font.family': "Microsoft YaHei"})
plt.title("中国票房2021TOP9")
plt.pie(cnbohints,labels=labels,explode=explo,shadow=True,startangle=45,autopct='%1.2f%%',wedgeprops={"edgecolor":"black"})
plt.show()
以上是“Python+matplotlib如何实现饼图的绘制”这篇文章的所有内容,感谢各位的阅读!希望分享的内容对大家有帮助,更多相关知识,欢迎关注亿速云行业资讯频道!
免责声明:本站发布的内容(图片、视频和文字)以原创、转载和分享为主,文章观点不代表本网站立场,如果涉及侵权请联系站长邮箱:is@yisu.com进行举报,并提供相关证据,一经查实,将立刻删除涉嫌侵权内容。


