温馨提示×

温馨提示×

您好,登录后才能下订单哦!

密码登录×
登录注册×
其他方式登录
点击 登录注册 即表示同意《亿速云用户服务条款》

jquer 获取json数据,并且用 highcharts 实现展现

发布时间:2020-06-29 01:34:24 来源:网络 阅读:1004 作者:tianshuai369 栏目:web开发

json数据格式如下:

{

   "value": [
        23,
        4,
	24,
	95,
	27,
	35,
	93,
	63,
	75,
	17,
	13,
	93,
	54,
	71,
	61,
	14,
	13,
        14,
        29
    ]


}

需要highcharts的dark-blue.js文件

html文件格式如下:

<!doctype html>
<html lang="en">
<head>
  <script type="text/javascript" src="http://cdn.hcharts.cn/jquery/jquery-1.8.3.min.js"></script>
  <script type="text/javascript" src="http://cdn.hcharts.cn/highcharts/highcharts.js"></script>
  <script type="text/javascript" src="http://cdn.hcharts.cn/highcharts/exporting.js"></script>
  <script type="text/javascript" src="dark-blue.js"></script>
  <script>
  $(document).ready(function() {
    $.getJSON('http://1.1.1.1:800/1.json', { }, function (json_data) {
    //左侧Javascript代码
 $(function () {                                                                     
    $(document).ready(function() {                                                  
        Highcharts.setOptions({                                                     
            global: {                                                               
                useUTC: false                                                       
            }                                                                       
        });                                                                         
                                                                                    
        var chart;                                                                  
        $('#container').highcharts({                                                
            chart: {                                                                
                type: 'spline',                                                     
                animation: Highcharts.svg,             
                marginRight: 10,                                                    
                events: {                                                           
                                                                           
                }                                                                   
            },                                                                      
            title: {                                                                
                text: '流量图'                                            
            },                                                                      
            xAxis: {   
    title: {                                                            
                    text: '时间'                                                   
                },
                type: 'datetime',                                                   
                tickPixelInterval: 150                                              
            },
   credits: {          
    enabled:false
   },  
            yAxis: {                                                                
                title: {                                                            
                    text: '单位/M'                                                   
                },                                                                  
                plotLines: [{                                                       
                    value: 0,                                                       
                    width: 1,                                                       
                    color: '#808080'                                                
                }]                                                                  
            },                                                                      
            tooltip: {                                                              
                formatter: function() {                                             
                        return '<b>'+ this.series.name +'</b><br/>'+                
                        Highcharts.dateFormat("时间:"+ '%m-%d %H:%M:%S', this.x) +'<br/>'+
                        "数据:" + Highcharts.numberFormat(this.y, 2);                         
                }                                                                   
            },   
   
            legend: {                                                               
                enabled: false                                                      
            },                                                                      
            exporting: {                                                            
                enabled: false                                                      
            },                                                                      
            series: [{                                                              
                name: '实时数据',                                                
                data: (function() {  
                    // generate an array of random data                             
                    var data = [],                                                  
                        time = (new Date()).getTime(),                            
                      length=((json_data.value).length)+1;
      
     $.each(json_data.value, function(i, value) {      
         data.push({                                                 
                            x: time - length * 1000, 
                            y: value                                       
                        }); 
      length--;      
     });                                                                  
                    return data;                                                    
                })()                                                                
            }]                                                                      
        });                                                                         
    });                                                                             
                                                                                    
});  
}); 
});                                                                                    
  </script>
</head>
<body>
  <div id="container" ></div>
</body>
</html>
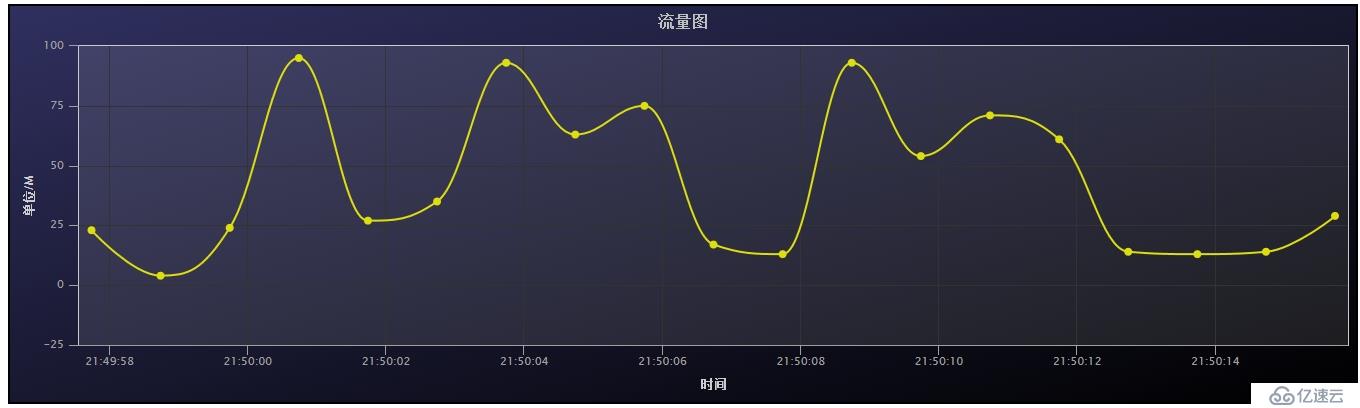
最终展现效果如下:

jquer 获取json数据,并且用 highcharts 实现展现

向AI问一下细节

免责声明:本站发布的内容(图片、视频和文字)以原创、转载和分享为主,文章观点不代表本网站立场,如果涉及侵权请联系站长邮箱:is@yisu.com进行举报,并提供相关证据,一经查实,将立刻删除涉嫌侵权内容。

AI