Jquery easyui : 实现前端数据包格式化输出,支持多种模块式定义,只需要添加相应的预设参数即可实现丰富的前端。
资料参考: http://www.jeasyui.com/
Jquery sparkline: 基于jQuery 的js插件,底层调用html5的canvas标签,并通过js动态实现在数据表行内画条形图或趋势图,操作简单,可实现不同类型的图形化,如线形图,饼状图,柱形图。
资料参考:http://omnipotent.net/jquery.sparkline/#s-docs
注意:sparkline依赖于jQuery1.4.3或以上的版本
jqplot: 也是基于jQuery 的js插件,可以实现基于数据画趋势图,主要是线形图为主。
资料参考: http://www.jqplot.com/tests/
1) 要使用以上插件的先行条件是要预先加载在html里。
<head>
    <meta http-equiv="Content-Type" content="text/html; charset=UTF-8">
    <title><?php echo $title?></title>
    <link rel="stylesheet" type="text/css" href="//img.6waves.com/jquery-easyui/themes/gray/easyui.css">
    <link rel="stylesheet" type="text/css" href="//img.6waves.com/jquery-easyui/themes/icon.css">
    <link rel="stylesheet" type="text/css" href="//code.jquery.com/ui/1.8.1/themes/smoothness/jquery-ui.css">
    <link rel="stylesheet" type="text/css" href="css/style.css">
    <link rel="stylesheet" type="text/css" href="css/jquery.jqplot.min.css">
    <script type="text/javascript" src="//ajax.googleapis.com/ajax/libs/jquery/1.8.1/jquery.min.js"></script>
    <script type="text/javascript" src="//code.jquery.com/ui/1.8.1/jquery-ui.min.js"></script>
    <script type="text/javascript" src="//img.6waves.com/jquery-easyui/jquery.easyui.min.js"></script>
    <script type="text/javascript" src="js/jqplot/jquery.jqplot.min.js"></script>
    <script type="text/javascript" src="js/jqplot/plugins/jqplot.highlighter.min.js"></script>
    <script type="text/javascript" src="js/jqplot/plugins/jqplot.cursor.min.js"></script>
    <script type="text/javascript" src="js/jqplot/plugins/jqplot.dateAxisRenderer.min.js"></script>
    <script type="text/javascript" src="js/jqplot/plugins/jqplot.pointLabels.min.js"></script>
    <script type="text/javascript" src="js/jquery.serializeobject.js"></script>
    <script type="text/javascript" src="js/jquery.sparkline.min.js"></script>
    <script type="text/javascript" src="js/common.js"></script>
</head>
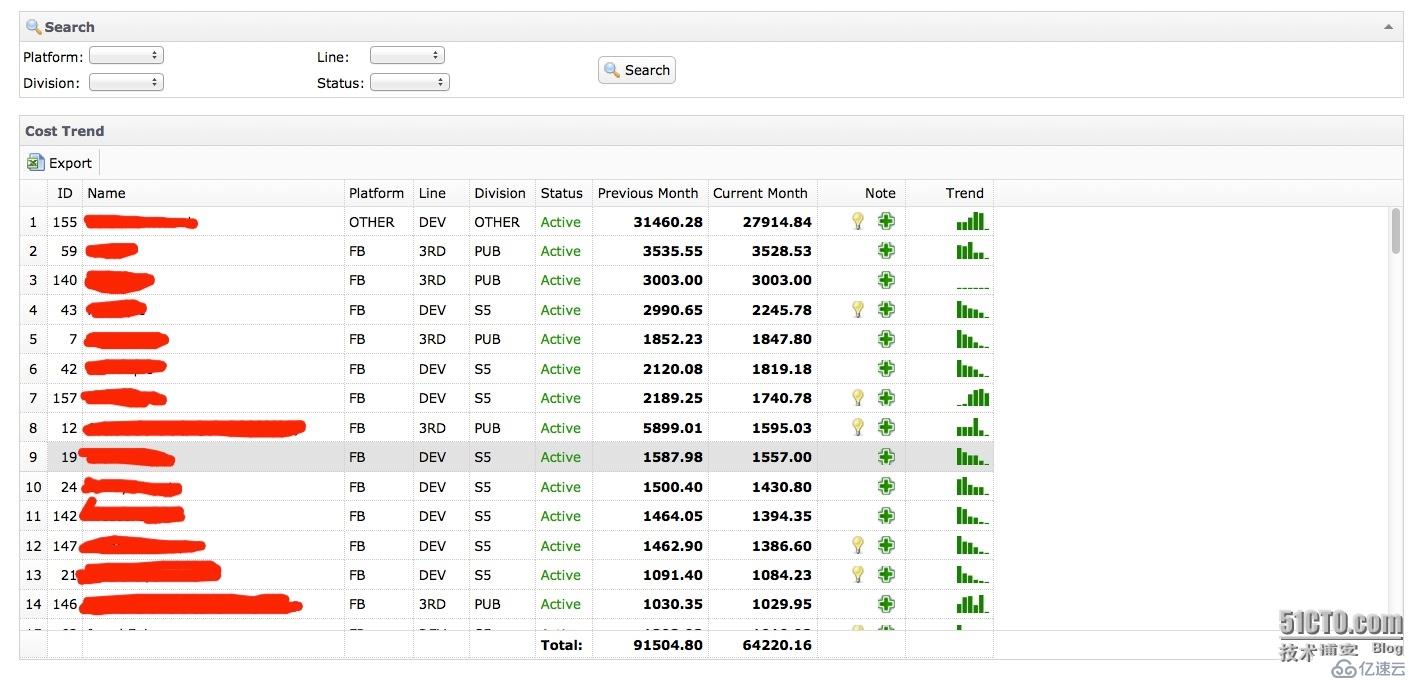
2)在表格里调用jquery easyui的datagrid插件
<th data-options="field:'trend',width:80,title:'Trend',formatter:formatTrend" align="right"></th>
通过formatTrend函数实现循环把数据表指定列格式化,格式化后的内容在往后的js中调用,formatTrend函数定义如下:
function formatTrend (value,row,index) {
    var rs='';
    rs = '<div id=\'sparkline-jqplot-'+row.game_id +'\'><a href=\'#\' onclick=\'startGraph(this.parentNode.id,'+row.game_id+',6)\' alt=\'cost trend\' title=\'Click for more records\'> <span class=sparkline-cost-trend id=sparkline-'+row.game_id+'></span></a></div>';
    return rs;
}
以上生成的列添加了一个onclick事件,点击后发送请求,然后根据返回数据生成jqplot线性图。
生成的html格式如图一

3)调用sparkline插件实现在页面加载完后发送ajax请求,获取数据后循环实现Trend这列的线形图的生成。
   function loadSparkline(){
        $.getJSON('cost_category_json.php?all&limit=6',function(data){
            $.each(data,function(i,value){
                $("#sparkline-"+i).sparkline(value,{type: 'bar', barColor: 'green',colorMap: { '0': '#f00' }} );
                //alert(value);
            })
                })
        }
发送请求后获取到的数据格式为:
{"1":[13.91,13.91,13.91,13.91,13.91,13.91],"2":[0,0,0,0,0,0],"3":[0,0,0,0,0,0],"4":[0,0,0,0,0,0],"5":[0.95,0.83,0,0,0,0],"6":[469.6,507.3,471.7,502.39,481.5,15.16],"7":[1887.9,1878.55,1873.13,1858.78,1852.23,1847.83],"8":[0,0,0,0,0,0],"9":[0,0,0,0,0,0],"10":[1239.73,1346.16,965.09,960.64,909.87,25.4],"11":[0,0,0,0,0,0],"12":[9207.24,9229.72,9538.5,17691.83,5899.01,1595.48],"13":[836.9,549.2,329.03,272.6,273.53,250.9],"14":[5.85,0,0,0,0,0],"15":[0,0,0,0,0,0],"16":[0,0,0,0,0,0],"17":[0,0,0,0,0,0],"18":[1046.8,1037.73,1030.13,1025.93,646.8,641.9],"19":[1693.25,1658.83,1636.73,1635.85,1587.98,1557.3],"20":[144.41,125.14,106.3,98.34,85.32,76.71],"21":[1178.43,1140.4,1123.48,1101.68,1091.4,1084.38],"22":[701.3,712.13,707.93,701.38,695.33,692.98],"23":[0.03,0.05,0.05,0.03,0.03,0],"24":[1573.4,1583.9,1519.28,1500.05,1500.4,1431.53],"25":[0,0,0,0,0,0],"26":[0,0,0,0,0,0],"27":[0,0,164.9,164.9,164.9,164.9],"28":[0,0,0,0,0,0],"29":[0,0,0,0,0,0],"30":[0,0,0,0,0,0],"31":[0,0,0,0,0,0],"32":[0,0,0,0,0,0],"33":[0.83,0.98,0.9,0.6,0.48,0.5],"34":[299,335.35,319.73,299.98,265.7,262.78],"35":[79.63,7.38,3.53,0,0,0],"36":[0,0,0,0,0,0],"37":[0,0,0,0,0,0],"38":[3,2.9,2.13,1.68,1.18,1.2],"39":[422,422,422,422,422,422],"40":[0,0,0,0,0,0],"41":[0,0,0,0,0,0],"42":[3419.29,2895.35,2808.58,2488.38,2120.08,1820.35],"43":[4566.98,4024.83,3548.95,3381.23,2990.65,2246.88],"44":[1.4,11.73,10.78,5.1,2.68,2.33],"45":[309,309,0,0,0,0],"46":[0,0,0,0,0,0],"47":[299.18,203.28,197.53,182.48,165.1,176.23],"48":[132.13,100.9,85.43,73.33,71.9,69.73],"49":[0,0,0,0,0,0],"50":[0,0,0,0,0,0],"51":[0,0,0,0,0,0],"52":[0,0,0,0,0,0],"53":[0,0,0,0,0,0],"54":[1070,1018.05,964.3,949.3,908.4,880.88],"55":[0,0,0,0,0,0],"56":[0,0,0,0,0,0],"57":[0,0,0,0,0,0],"58":[469.68,469.4,0.98,1.03,0.95,0],"59":[3543.3,3542.3,3546.58,3535.65,3535.55,3528.48],"60":[0,0,0,0,0,0],"61":[0,0,0,0,0,0],"62":[0,0,0,0,0,0],"63":[2070.15,1396.68,1256.9,1381.05,1303.03,1011.28],"64":[0,0,0,0,0,0],"65":[1920.97,2040.92,1704.52,1630.88,207.43,0],"66":[217.08,184.45,159.4,174.88,131.25,125.7],"67":[0,0,0,0,0,0],"68":[159,159,159,159,159,159],"69":[1855.58,1995.69,1668.02,1644.74,1551.83,38.07],"70":[0,0,0,0,0,0],"71":[485.88,494.18,486.08,479.08,477.85,476.05],"72":[0,0,0,0,0,0],"73":[0,0,0,0,0,0],"74":[722.13,714.35,718.3,716.63,0,0],"75":[0,0,0,0,0,0],"76":[0,0,0,0,0,0],"77":[0,0,0,0,0,0],"78":[9968.31,8427.55,5857.99,5986.05,5696.6,427.45],"79":[540.88,516.7,520.4,47.68,24.75,21.05],"80":[556.9,551.4,547.63,541.8,542,538.85],"81":[1468.76,1440.15,1096.66,1010.57,954.17,26.74],"82":[0,0,0,0,0,0],"83":[0,0,0,0,0,0],"84":[306.18,302.53,301.2,301.25,300.88,299.63],"85":[0,0,0,0,0,0],"86":[0,0,0,0,0,0],"87":[16.45,60.55,94.68,115.48,136.68,203.68],"88":[0,0,0,0,0,0],"89":[0,0,0,0,0,0],"90":[0,0,0,0,0,0],"91":[0,0,0,0,0,0],"92":[0,0,0,0,0,0],"93":[0,0,0,0,0,0],"94":[0,0,0,0,0,0],"95":[0,0,0,0,0,0],"96":[0,0,0,0,0,0],"97":[0,0,0,0,0,0],"98":[32.65,42.55,39.48,54.83,14.8,12.7],"99":[0,0,0,0,0,0],"100":[0,0,0,0,0,0],"101":[0,0,0,0,0,0],"102":[0,0,0,0,0,0],"103":[0,0,0,0,0,0],"104":[0,0,0,0,0,0],"105":[0,0,0,0,0,0],"106":[1.13,0.95,0.9,0.8,0.75,0.73],"107":[0,0,0,0,0,0],"108":[0,0,0,0,0,0],"109":[0,0,0,0,0,0],"110":[804.38,881.7,817.14,858.67,838.27,34.83],"111":[31.18,13.7,2.73,0,0,0],"112":[41.65,43.13,42.4,42.4,42.4,42.5],"113":[0,0,0,0,0,0],"114":[0,0,0,0,0,0],"115":[0,0,0,0,0,0],"116":[0,0,0,0,0,0],"117":[554.22,605.86,422.94,434.01,116.45,0],"118":[0,0,0,0,0,0],"119":[0,0,0,0,0,0],"120":[0,0,0,0,0,0],"121":[578,578,0,0,0,0],"122":[0,0,0,0,0,0],"123":[84.08,60.3,62.3,0.03,0,0],"124":[0,0,0,0,0,0],"125":[0,0,0,0,0,0],"126":[527.14,582.59,535.64,516.09,484.36,474.84],"127":[1577.8,1696.22,1565.31,1433.35,1359.2,793.79],"128":[8.75,4.63,5.95,6.95,4.63,9.25],"129":[0,0,0,0,0,0],"130":[0,0,0,0,0,0],"131":[53.26,2.6,0,0,0,0],"132":[0,0,0,0,0,0],"133":[0,0,0,0,0,0],"134":[263.36,249,249,249,249,249],"135":[0,0,0,0,0,0],"136":[0,0,0,0,0,0],"137":[0,0,0,0,0,0],"138":[698,698,698,698,698,698],"139":[0,0,0,0,0,0],"140":[3003,3003,3003,3003,3003,3003],"141":[37.48,34.73,30.28,25.33,23.63,21.83],"142":[1959.9,1890.18,1648.18,1607.23,1464.05,1396.03],"143":[0,0,0,0,0,0],"144":[0,0,0,0,0,0],"145":[0,0,0,0,0,0],"146":[1030.15,1030.3,1030.33,1030.13,1030.35,1030.03],"147":[2049.25,1835.3,1810.2,1623.95,1462.9,1388.55],"148":[0,0,0,0,0,0],"149":[289.75,294.48,317.28,304.15,299.4,312.15],"150":[0,0,0,0,0,0],"151":[0,0,0,0,0,0],"152":[0,0,0,0,0,0],"153":[0,0,0,0,0,0],"154":[0,0,0,0,0,0],"155":[29502.44,29447.89,30560.38,31556.05,31460.28,27915.62],"156":[428,428,428,428,428,428],"157":[468.8,586.25,1710.4,2091.53,2189.25,1741.2],"158":[67.98,349.58,342.53,502.8,869.45,999.4],"159":[0,0,0.35,2.45,4.45,6.85],"160":[5087.65,5619.93,4063.94,4162.6,3966.53,322.77],"161":[67.98,216.38,0],"163":[0,0],"164":[0,0],"165":[0,0],"166":[0,658.15,723.18,683.01,31.7],"167":[2143.14,2748.75,2840.28,2714.37,76.35],"168":[0],"169":[0],"170":[1346.16,470.76],"171":[269,269,269,269,269],"172":[0,199.7,202.55,202.05,201.3],"173":[0,1.98,728.8,103.15,176.45],"174":[0,0,0,0,0],"175":[469.15,468]}在页面加载完后调用以上函数:
setTimeout(loadSparkline(),15000);
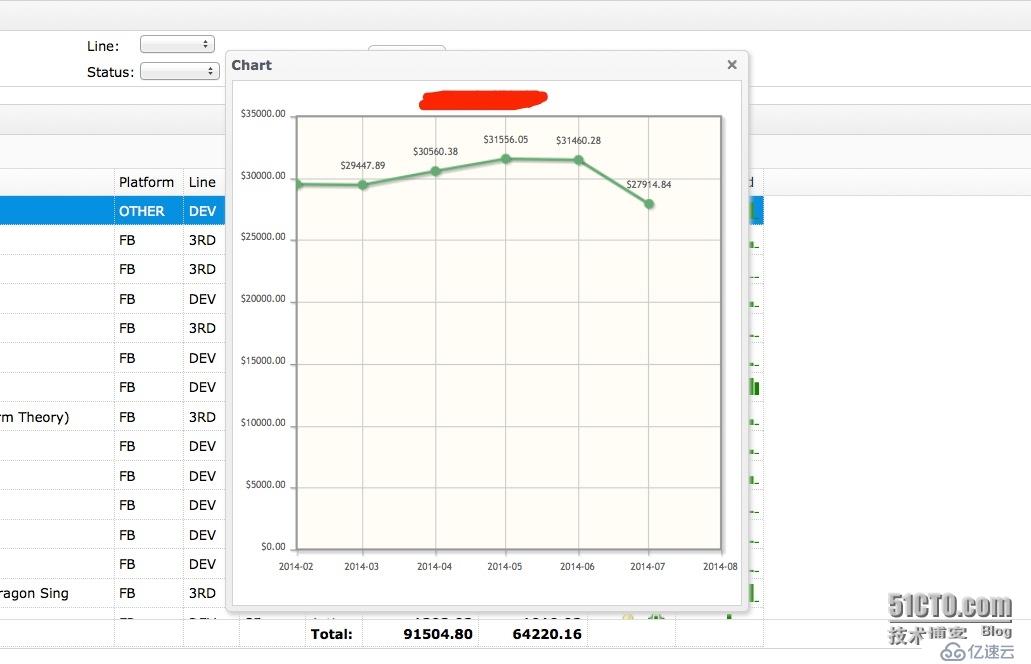
4)第二步铺垫下来的onclick事件,startGraph函数:
function startDrawCanvas(id,data,title) {
        $.jqplot(id, data,
        {   title:title,
            axes:{  xaxis:{ renderer:$.jqplot.DateAxisRenderer,
                            tickOptions:{
                                            formatString:'%Y-%m'
                                        }
                            },
                    yaxis:{ min:0,
                             tickOptions:{
                                             formatString:'$%.2f'
                                        }
                            }
                },
            series:[{color:'#5FAB78'}],
            cursor:{style: 'crosshair', show:false, showTooltip: false},
                    seriesDefaults: {
                    showMarker:true,
                    pointLabels: { show:true }
            },
            highlighter: {  show: true,
                            tooltipAxes: 'both',
    }
})
};
function startGraph(id,game_id,limit) {
url="cost_category_json.php";
$.ajax({
url: url,
type: "GET",
dataType: "json",
data: {game_id:game_id,limit:limit},
success: function(data) {
var rs=data
var dt=rs.data;
var title=rs.name;
//alert(title+dt)
var dialogdiv='dialog-'+game_id
var chartdiv='chart-'+game_id
$("#"+id).after("<div id=\""+chartdiv+"\" class=\"chartdiv\" style=\"height:450px;width:450px;\"></div>");
$("#"+chartdiv).wrap("<div id="+dialogdiv+" style=\"height:480px;width:480px\"></div>");
//var data=[[['2014-01', 2],['2014-02',5.12],['2014-03',13.1],['2014-04',33.6],['2014-05',85.9],['2014-06',219.9],['2014-07',39.9],['2014-08',99.9]]];
//var title='Fruit Jamba';
//$("#"+chartdiv).css("display","block");
startDrawCanvas(chartdiv,[dt],title) ;
$("#"+dialogdiv).dialog({ modal:false,title:"Chart", height:"550px"});
},
error: function() {
alert("ERROR!!!");
}
});
}startGraph函数发送的请求获取到得数据格式为:
{"name":"*** internal","data":[["2014-02",29502.44],["2014-03",29447.89],["2014-04",30560.38],["2014-05",31556.05],["2014-06",31460.28],["2014-07",27914.84]]}5) 效果图
图一

图二
图三
免责声明:本站发布的内容(图片、视频和文字)以原创、转载和分享为主,文章观点不代表本网站立场,如果涉及侵权请联系站长邮箱:is@yisu.com进行举报,并提供相关证据,一经查实,将立刻删除涉嫌侵权内容。


