
Morris.js 是基于 jQuery 和 Raphaël 的轻量级矢量图形库,帮助开发人员轻松绘制各种形式的图表。示例:
HTML:
<div id="myfirstchart"></div> |
JavaScript:
newMorris.Line({
// ID of the element in which to draw the chart.
element: 'myfirstchart',
// Chart data records -- each entry in this array corresponds to a point on
// the chart.
data: [
{ year: '2008', value: 20 },
{ year: '2009', value: 10 },
{ year: '2010', value: 5 },
{ year: '2011', value: 5 },
{ year: '2012', value: 20 }
],
// The name of the data record attribute that contains x-values.
xkey: 'year',
// A list of names of data record attributes that contain y-values.
ykeys: ['value'],
// Labels for the ykeys -- will be displayed when you hover over the
// chart.
labels: ['Value']
});
效果展示

jQuery OrgChart 是一款用于呈现易于阅读的嵌套元素的树结构插件。
Cytoscape.js
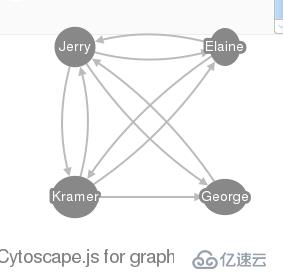
效果展示
免责声明:本站发布的内容(图片、视频和文字)以原创、转载和分享为主,文章观点不代表本网站立场,如果涉及侵权请联系站长邮箱:is@yisu.com进行举报,并提供相关证据,一经查实,将立刻删除涉嫌侵权内容。


