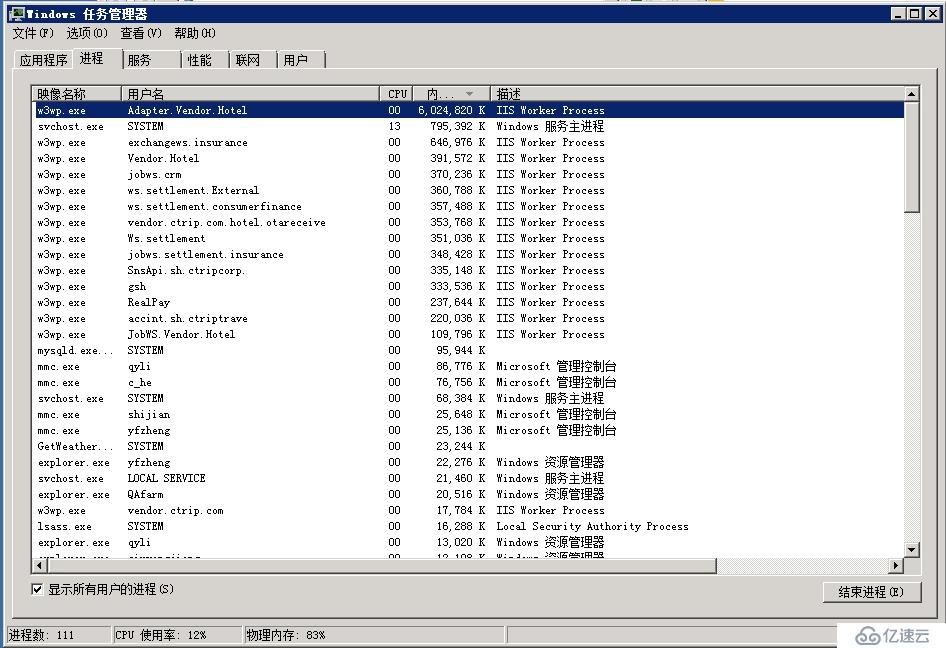
监控每个进程占用的cpu,比如任务管理器的进程tab中的CPU
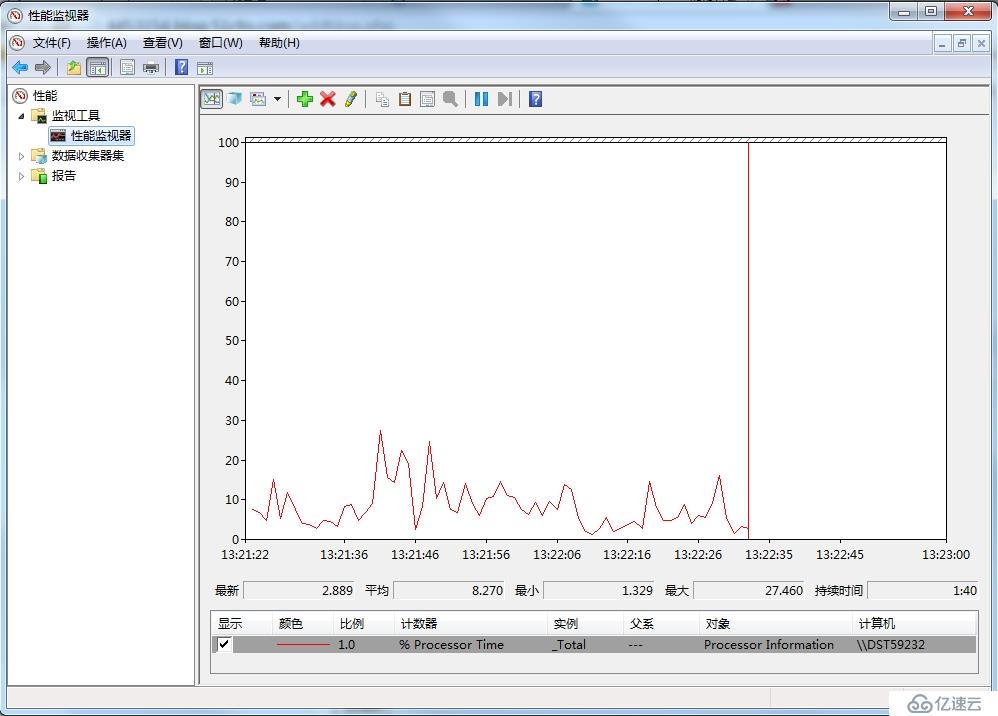
在代码里,可以通过新建PerformanceCounter来建立监控,其对应的Windows中的自带性能分析工具Perfmon
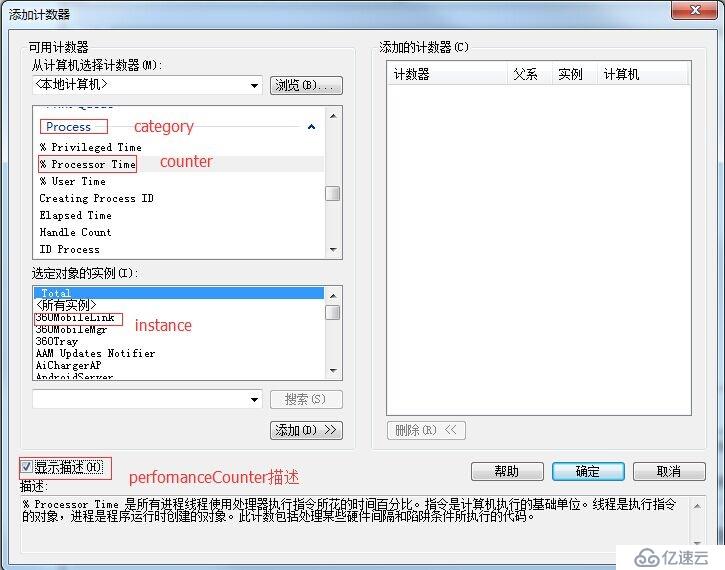
看下该类的定义中,只要有三个概念:
categoryName:
The name of the performance counter category (performance object) with which
this performance counter is associated.
counterName:
The name of the performance counter.
instanceName:
The name of the performance counter category instance, or an empty string
(""), if the category contains a single instance.
其对应关系如下:
由于instance是变化的,所以每次要根据Process得到instance,那么process跟instance间的关系如何,请看:
PerformanceCounter("Process", "ID Process", instance)这个指标取NextValue()就是ProcessID,就可以跟Process对应起来
但是注意,每个Catagory下面的instance都是不同的,所有Process下的instance到其他Category下就不识别了。
获取instance代码如下:
public static string GetInstanceName(string categoryName, string counterName, Process p)
        {
            try
            {
                PerformanceCounterCategory processcounter = new PerformanceCounterCategory(categoryName);
                string[] instances = processcounter.GetInstanceNames();
                foreach (string instance in instances)
                {
                    PerformanceCounter counter = new PerformanceCounter(categoryName, counterName, instance);
                    //Logger.Info("对比in mothod GetInstanceName," + counter.NextValue() + ":" + p.Id);
                    if (counter.NextValue() == p.Id)
                    {
                        return instance;
                    }
                }
            }
            catch (Exception ex)
            {
            }
            return null;
        }
获取cpu占用率的PerformanceCounter:
string instance1 = GetInstanceName("Process", "ID Process", p);
if (instance1 != null)
{
PerformanceCounter cpucounter = new PerformanceCounter("Process", "% Processor Time", instance1);
if (cpucounter != null)
{
cpucounter.NextValue();
System.Threading.Thread.Sleep(200); //等200ms(是测出能换取下个样本的最小时间间隔),让后系统获取下一个样本,因为第一个样本无效
return cpucounter;
}
else
{
Logger.Info("Name:" + name + "生成CPU监控失败" + instance1);
}
}
else
{
Logger.Info("Name:" + name + "获取cpu监控实例失败" + instance1);
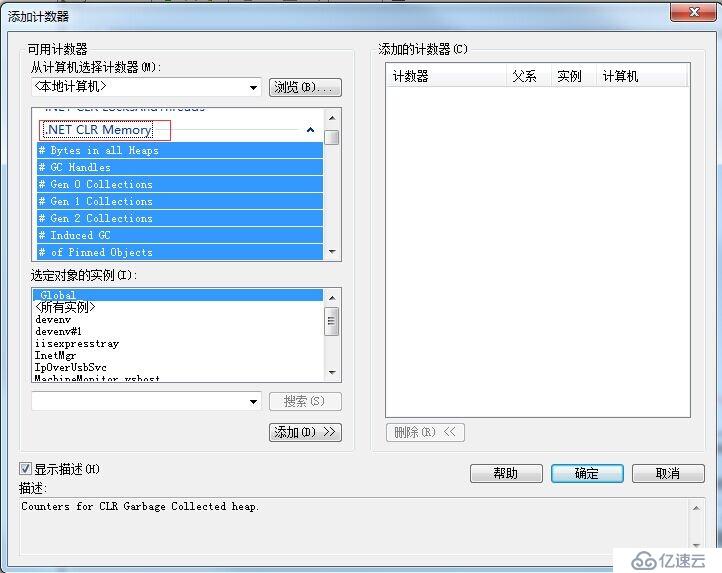
}获取GC占用率的PerformanceCounter:
GC选取了PerformanceCounter(".NET CLR Memory", "% Time in GC", instance2)这个counter,但注意,这两个属于不同Category,所以instance不能共用
代码如下:
// 获取GC占用率 PerformanceCounter
            string instance2 = GetInstanceName(".NET CLR Memory", "Process ID", p);
            if (instance2 != null)
            {
                PerformanceCounter gccounter = new PerformanceCounter(".NET CLR Memory", "% Time in GC", instance2);
                if (gccounter != null)
                {
                    return gccounter;
                    Logger.Info("Name:" + name + "生成GC监控成功" + instance2);
                }
                else
                {
                    Logger.Info("Name:" + name + "生成GC监控失败" + instance2);
                }
            }
            else
            {
                Logger.Info("Name:" + name + "获取GC监控实例失败" + instance2);
}免责声明:本站发布的内容(图片、视频和文字)以原创、转载和分享为主,文章观点不代表本网站立场,如果涉及侵权请联系站长邮箱:is@yisu.com进行举报,并提供相关证据,一经查实,将立刻删除涉嫌侵权内容。


