本篇文章为大家展示了ELK 5.0.1+Filebeat5.0.1 for LINUX RHEL6.6 监控MongoDB日志的示例分析,内容简明扼要并且容易理解,绝对能使你眼前一亮,通过这篇文章的详细介绍希望你能有所收获。
ELK5.0.1搭建用到的工具有:
filebeat-5.0.1-linux-x86_64.tar.gz
logstash-5.0.1.tar.gz
elasticsearch-5.0.1.tar.gz
kibana-5.0.1-linux-x86_64.tar.gz
以上4个工具可以https://www.elastic.co/downloads网址下的历史版本中找到。
除此之外,ELK5.0.1对操作系统内核有要求,要求LINUX操作系统内核大于3.5,本次实验使用的linux操作系统是ORACLE LINUX6.6;
另外,对JAVA JDK版本也有要求,最好安装jdk-8u111-linux-x64.tar.gz,可以在Oracle官方网站上找到并免费下载到。
linux主机需要修改的配置是:
vi /etc/sysctl.conf
vm.max_map_count = 262144
vi /etc/security/limits.conf
* soft nofile 65536
* hard nofile 131072
* soft nproc 2048
* hard nproc 4096
ELK的工作原理是:filebeat在数据库服务器mongodb上监控mongodb日志,并实时将mongodb的日志更新内容抓取到并发送给logstash,
logstash负责根据事先编辑好的正则及过滤条件对filebeat发送过来的数据进行过滤及正则解析,然后logstash将处理后的数据发送到elasticsearch引擎,
kibana负责展示elasticsearch中的数据,进行分类、汇总、查询、制表、画图等等。
安装流程是:
一、elasticsearch-5.0.1.tar.gz安装
确定操作系统版本内核大于3.5(这里需要说明的是es要求操作系统内核必须大于3.5,否则es5无法启动)
[root@rhel6 ~]# uname -a
Linux rhel6 3.8.13-44.1.1.el6uek.x86_64 #2 SMP Wed Sep 10 06:10:25 PDT 2014 x86_64 x86_64 x86_64 GNU/Linux
[root@rhel6 ~]#
确定系统JAVA版本为1.8
[root@rhel6 ~]# java -version
java version "1.8.0_111"
Java(TM) SE Runtime Environment (build 1.8.0_111-b14)
Java HotSpot(TM) 64-Bit Server VM (build 25.111-b14, mixed mode)
[root@rhel6 ~]#
创建es组、elasticsearch用户及es安装目录(这里要说明的是,es5启动不能使用root,否则报错无法启动)
软件安装目录:
/home/elasticsearch/elasticsearch-5.0.1
数据及日志存放目录:
/opt/es5.0.1
[root@rhel6 opt]# ls -l
total 20
drwxr-xr-x. 4 elasticsearch es 4096 Feb 13 19:47 es5.0.1
[root@rhel6 opt]# id elasticsearch
uid=700(elasticsearch) gid=700(es) groups=700(es)
[root@rhel6 opt]#
接下来就是解压安装elasticsearch-5.0.1.tar.gz,将elasticsearch-5.0.1.tar.gz解压到/home/elasticsearch/elasticsearch-5.0.1目录下并修改权限即可。
修改es的配置文件:
[root@rhel6 config]# vi elasticsearch.yml
path.data: /opt/es5.0.1/data
path.logs: /opt/es5.0.1/logs
network.host: 192.168.144.230 #IP地址是本机的ip地址
http.port: 9200 #es的web服务端口
使用elasticsearch用户启动es5:
[elasticsearch@rhel6 bin]$ ./elasticsearch
[2017-02-13T19:50:49,111][INFO ][o.e.n.Node ] [] initializing ...
[2017-02-13T19:50:49,362][INFO ][o.e.e.NodeEnvironment ] [58P-l3h] using [1] data paths, mounts [[/ (/dev/sda3)]], net usable_space [16.3gb], net total_space [23.4gb], spins? [possibly], types [ext4]
[2017-02-13T19:50:49,363][INFO ][o.e.e.NodeEnvironment ] [58P-l3h] heap size [1.9gb], compressed ordinary object pointers [true]
[2017-02-13T19:50:49,365][INFO ][o.e.n.Node ] [58P-l3h] node name [58P-l3h] derived from node ID; set [node.name] to override
[2017-02-13T19:50:49,390][INFO ][o.e.n.Node ] [58P-l3h] version[5.0.1], pid[3644], build[080bb47/2016-11-11T22:08:49.812Z], OS[Linux/3.8.13-44.1.1.el6uek.x86_64/amd64], JVM[Oracle Corporation/Java HotSpot(TM) 64-Bit Server VM/1.8.0_111/25.111-b14]
[2017-02-13T19:50:52,449][INFO ][o.e.p.PluginsService ] [58P-l3h] loaded module [aggs-matrix-stats]
[2017-02-13T19:50:52,450][INFO ][o.e.p.PluginsService ] [58P-l3h] loaded module [ingest-common]
[2017-02-13T19:50:52,450][INFO ][o.e.p.PluginsService ] [58P-l3h] loaded module [lang-expression]
[2017-02-13T19:50:52,450][INFO ][o.e.p.PluginsService ] [58P-l3h] loaded module [lang-groovy]
[2017-02-13T19:50:52,450][INFO ][o.e.p.PluginsService ] [58P-l3h] loaded module [lang-mustache]
[2017-02-13T19:50:52,450][INFO ][o.e.p.PluginsService ] [58P-l3h] loaded module [lang-painless]
[2017-02-13T19:50:52,451][INFO ][o.e.p.PluginsService ] [58P-l3h] loaded module [percolator]
[2017-02-13T19:50:52,451][INFO ][o.e.p.PluginsService ] [58P-l3h] loaded module [reindex]
[2017-02-13T19:50:52,452][INFO ][o.e.p.PluginsService ] [58P-l3h] loaded module [transport-netty3]
[2017-02-13T19:50:52,452][INFO ][o.e.p.PluginsService ] [58P-l3h] loaded module [transport-netty4]
[2017-02-13T19:50:52,460][INFO ][o.e.p.PluginsService ] [58P-l3h] no plugins loaded
[2017-02-13T19:50:56,213][INFO ][o.e.n.Node ] [58P-l3h] initialized
[2017-02-13T19:50:56,213][INFO ][o.e.n.Node ] [58P-l3h] starting ...
[2017-02-13T19:50:56,637][INFO ][o.e.t.TransportService ] [58P-l3h] publish_address {192.168.144.230:9300}, bound_addresses {192.168.144.230:9300}
[2017-02-13T19:50:56,642][INFO ][o.e.b.BootstrapCheck ] [58P-l3h] bound or publishing to a non-loopback or non-link-local address, enforcing bootstrap checks
[2017-02-13T19:50:59,864][INFO ][o.e.c.s.ClusterService ] [58P-l3h] new_master {58P-l3h}{58P-l3hGTqm7e9QzXWn0eA}{J3O-p0wfSMeS4evTxfTmVA}{192.168.144.230}{192.168.144.230:9300}, reason: zen-disco-elected-as-master ([0] nodes joined)
[2017-02-13T19:50:59,902][INFO ][o.e.h.HttpServer ] [58P-l3h] publish_address {192.168.144.230:9200}, bound_addresses {192.168.144.230:9200}
[2017-02-13T19:50:59,902][INFO ][o.e.n.Node ] [58P-l3h] started
[2017-02-13T19:50:59,930][INFO ][o.e.g.GatewayService ] [58P-l3h] recovered [0] indices into cluster_state
通过web页面访问:http://192.168.144.230:9200/?pretty,能看到类似如下信息,说明es启动成功并且正常提供服务:
{
"name" : "58P-l3h",
"cluster_name" : "elasticsearch",
"cluster_uuid" : "mO7oaIXJQyiwCEA-jsSueg",
"version" : {
"number" : "5.0.1",
"build_hash" : "080bb47",
"build_date" : "2016-11-11T22:08:49.812Z",
"build_snapshot" : false,
"lucene_version" : "6.2.1"
},
"tagline" : "You Know, for Search"
}
二、安装logstash6.0.1
创建软件安装目录:/opt/logstash-5.0.1
将logstash-5.0.1.tar.gz解压到安装目录
编辑 logstash.conf启动配置文件:
[root@rhel6 config]# cat logstash.conf
#input {
# stdin {}
#}
input{
beats {
host => "0.0.0.0"
port => 5044
}
}
output{
elasticsearch {
hosts => ["192.168.144.230:9200"]
index => "test"
}
stdout {
codec => rubydebug
}
}
[root@rhel6 config]#
启动logstash6
./logstash -f /opt/logstash-5.0.1/config/logstash.conf
看到如下输出,说明logstash启动成功:
[root@rhel6 bin]# ./logstash -f /opt/logstash-5.0.1/config/logstash.conf
Sending Logstash's logs to /opt/logstash-5.0.1/logs which is now configured via log4j2.properties
[2017-02-14T01:03:25,860][INFO ][logstash.inputs.beats ] Beats inputs: Starting input listener {:address=>"0.0.0.0:5044"}
[2017-02-14T01:03:25,965][INFO ][org.logstash.beats.Server] Starting server on port: 5044
[2017-02-14T01:03:26,305][INFO ][logstash.outputs.elasticsearch] Elasticsearch pool URLs updated {:changes=>{:removed=>[], :added=>["http://192.168.144.230:9200"]}}
[2017-02-14T01:03:26,307][INFO ][logstash.outputs.elasticsearch] Using mapping template from {:path=>nil}
[2017-02-14T01:03:26,460][INFO ][logstash.outputs.elasticsearch] Attempting to install template {:manage_template=>{"template"=>"logstash-*", "version"=>50001, "settings"=>{"index.refresh_interval"=>"5s"}, "mappings"=>{"_default_"=>{"_all"=>{"enabled"=>true, "norms"=>false}, "dynamic_templates"=>[{"message_field"=>{"path_match"=>"message", "match_mapping_type"=>"string", "mapping"=>{"type"=>"text", "norms"=>false}}}, {"string_fields"=>{"match"=>"*", "match_mapping_type"=>"string", "mapping"=>{"type"=>"text", "norms"=>false, "fields"=>{"keyword"=>{"type"=>"keyword"}}}}}], "properties"=>{"@timestamp"=>{"type"=>"date", "include_in_all"=>false}, "@version"=>{"type"=>"keyword", "include_in_all"=>false}, "geoip"=>{"dynamic"=>true, "properties"=>{"ip"=>{"type"=>"ip"}, "location"=>{"type"=>"geo_point"}, "latitude"=>{"type"=>"half_float"}, "longitude"=>{"type"=>"half_float"}}}}}}}}
[2017-02-14T01:03:26,483][INFO ][logstash.outputs.elasticsearch] New Elasticsearch output {:class=>"LogStash::Outputs::ElasticSearch", :hosts=>["192.168.144.230:9200"]}
[2017-02-14T01:03:26,492][INFO ][logstash.pipeline ] Starting pipeline {"id"=>"main", "pipeline.workers"=>2, "pipeline.batch.size"=>125, "pipeline.batch.delay"=>5, "pipeline.max_inflight"=>250}
[2017-02-14T01:03:26,500][INFO ][logstash.pipeline ] Pipeline main started
[2017-02-14T01:03:26,552][INFO ][logstash.agent ] Successfully started Logstash API endpoint {:port=>9600}
三、kinaba5.0.1安装
创建软件安装目录:[root@rhel6 kibana-5.0.1]# pwd
/opt/kibana-5.0.1
[root@rhel6 kibana-5.0.1]#
将kibana-5.0.1-linux-x86_64.tar.gz解压到安装目录,修改配置文件
vi /opt/kibana-5.0.1/config/kibana.conf
server.port: 5601
server.host: "192.168.144.230"
server.name: "rhel6"
elasticsearch.url: "http://192.168.144.230:9200" #这里指定的是从elasticsearch相关的服务http读取数据
pid.file: /var/run/kibana.pid
root启动kinaba5.0.1,看到如下信息输出,说明kinaba启动成功并成连接到elasticsearch:
[root@rhel6 bin]# ./kibana
log [13:04:52.598] [info][status][plugin:kibana@5.0.1] Status changed from uninitialized to green - Ready
log [13:04:52.657] [info][status][plugin:elasticsearch@5.0.1] Status changed from uninitialized to yellow - Waiting for Elasticsearch
log [13:04:52.693] [info][status][plugin:console@5.0.1] Status changed from uninitialized to green - Ready
log [13:04:52.947] [info][status][plugin:timelion@5.0.1] Status changed from uninitialized to green - Ready
log [13:04:52.968] [info][listening] Server running at http://192.168.144.230:5601
log [13:04:52.970] [info][status][ui settings] Status changed from uninitialized to yellow - Elasticsearch plugin is yellow
log [13:04:58.016] [info][status][plugin:elasticsearch@5.0.1] Status changed from yellow to yellow - No existing Kibana index found
log [13:04:58.643] [info][status][plugin:elasticsearch@5.0.1] Status changed from yellow to green - Kibana index ready
log [13:04:58.645] [info][status][ui settings] Status changed from yellow to green - Ready
四、filebeat安装
创建软件安装目录:
/opt/filebeat-5.0.1
将压缩包filebeat-5.0.1-linux-x86_64.tar.gz解压到软件安装目录,修改配置文件
[root@rhel6 filebeat-5.0.1]# vi filebeat.yml
paths:
- /opt/logs/*.log #定义日志的监控目录
output.logstash:
# The Logstash hosts
hosts: ["localhost:5044"]
root启动filebeat5
[root@rhel6 filebeat-5.0.1]# ./filebeat -e -c filebeat.yml -d "Publish"
2017/02/13 15:45:47.498852 beat.go:264: INFO Home path: [/opt/filebeat-5.0.1] Config path: [/opt/filebeat-5.0.1] Data path: [/opt/filebeat-5.0.1/data] Logs path: [/opt/filebeat-5.0.1/logs]
2017/02/13 15:45:47.498913 beat.go:174: INFO Setup Beat: filebeat; Version: 5.0.1
2017/02/13 15:45:47.498966 logstash.go:90: INFO Max Retries set to: 3
2017/02/13 15:45:47.499008 outputs.go:106: INFO Activated logstash as output plugin.
2017/02/13 15:45:47.499055 publish.go:291: INFO Publisher name: rhel6
2017/02/13 15:45:47.499169 async.go:63: INFO Flush Interval set to: 1s
2017/02/13 15:45:47.499180 async.go:64: INFO Max Bulk Size set to: 2048
2017/02/13 15:45:47.499241 beat.go:204: INFO filebeat start running.
2017/02/13 15:45:47.499251 registrar.go:66: INFO Registry file set to: /opt/filebeat-5.0.1/data/registry
2017/02/13 15:45:47.499309 registrar.go:99: INFO Loading registrar data from /opt/filebeat-5.0.1/data/registry
2017/02/13 15:45:47.499337 registrar.go:122: INFO States Loaded from registrar: 0
2017/02/13 15:45:47.499346 crawler.go:34: INFO Loading Prospectors: 1
2017/02/13 15:45:47.499381 logp.go:219: INFO Metrics logging every 30s
2017/02/13 15:45:47.499386 prospector_log.go:40: INFO Load previous states from registry into memory
2017/02/13 15:45:47.499431 prospector_log.go:67: INFO Previous states loaded: 0
2017/02/13 15:45:47.499479 crawler.go:46: INFO Loading Prospectors completed. Number of prospectors: 1
2017/02/13 15:45:47.499487 crawler.go:61: INFO All prospectors are initialised and running with 0 states to persist
2017/02/13 15:45:47.499501 prospector.go:106: INFO Starting prospector of type: log
2017/02/13 15:45:47.499630 log.go:84: INFO Harvester started for file: /opt/logs/firstset.log
文件目录下/opt/logs/我放了一个mongodb的log文件,暂时是静态的,后期可以修改,firstset.log的内容:
[root@rhel6 logs]# cat firstset.log
2017-02-11T06:44:42.954+0000 I COMMAND [conn6] command wangxi.t command: insert { insert: "t", documents: [ { _id: ObjectId('589eb2da39e265f288b9d9ae'), name: "wangxi" } ], ordered: true } ninserted:1 keyUpdates:0 writeConflicts:0 numYields:0 reslen:25 locks:{ Global: { acquireCount: { r: 2, w: 2 } }, Database: { acquireCount: { w: 1, W: 1 } }, Collection: { acquireCount: { W: 1 } } } protocol:op_command 7ms
2017-02-11T06:45:59.907+0000 I COMMAND [conn7] command wangxi.t command: find { find: "t", filter: { name: "wangxi" } } planSummary: COLLSCAN keysExamined:0 docsExamined:1 cursorExhausted:1 keyUpdates:0 writeConflicts:0 numYields:0 nreturned:1 reslen:141 locks:{ Global: { acquireCount: { r: 2 } }, Database: { acquireCount: { r: 1 } }, Collection: { acquireCount: { r: 1 } } } protocol:op_command 0ms
[root@rhel6 logs]#
然后观察logstash窗口有如下内容输出(说明filebeat读取到了/opt/logs/firstset.log日志并发送到logstash):
[2017-02-14T01:21:29,779][INFO ][logstash.agent ] Successfully started Logstash API endpoint {:port=>9600}
{
"@timestamp" => 2017-02-13T17:22:08.837Z,
"offset" => 413,
"@version" => "1",
"input_type" => "log",
"beat" => {
"hostname" => "rhel6",
"name" => "rhel6",
"version" => "5.0.1"
},
"host" => "rhel6",
"source" => "/opt/logs/firstset.log",
"message" => "2017-02-11T06:44:42.954+0000 I COMMAND [conn6] command wangxi.t command: insert { insert: \"t\", documents: [ { _id: ObjectId('589eb2da39e265f288b9d9ae'), name: \"wangxi\" } ], ordered: true } ninserted:1 keyUpdates:0 writeConflicts:0 numYields:0 reslen:25 locks:{ Global: { acquireCount: { r: 2, w: 2 } }, Database: { acquireCount: { w: 1, W: 1 } }, Collection: { acquireCount: { W: 1 } } } protocol:op_command 7ms",
"type" => "log",
"tags" => [
[0] "beats_input_codec_plain_applied"
]
}
{
"@timestamp" => 2017-02-13T17:22:08.837Z,
"offset" => 816,
"@version" => "1",
"input_type" => "log",
"beat" => {
"hostname" => "rhel6",
"name" => "rhel6",
"version" => "5.0.1"
},
"host" => "rhel6",
"source" => "/opt/logs/firstset.log",
"message" => "2017-02-11T06:45:59.907+0000 I COMMAND [conn7] command wangxi.t command: find { find: \"t\", filter: { name: \"wangxi\" } } planSummary: COLLSCAN keysExamined:0 docsExamined:1 cursorExhausted:1 keyUpdates:0 writeConflicts:0 numYields:0 nreturned:1 reslen:141 locks:{ Global: { acquireCount: { r: 2 } }, Database: { acquireCount: { r: 1 } }, Collection: { acquireCount: { r: 1 } } } protocol:op_command 0ms",
"type" => "log",
"tags" => [
[0] "beats_input_codec_plain_applied"
]
}
然后,访问http://192.168.144.230:5601/app/kibana#/management/kibana/indices/test?_g=()&_a=(tab:indexedFields)创建test索引(这里的索引是是logstash启动控制文件里的索引名称):
[root@rhel6 config]# cat logstash.conf
#input {
# stdin {}
#}
input{
beats {
host => "0.0.0.0"
port => 5044
}
}
output{
elasticsearch {
hosts => ["192.168.144.230:9200"]
index => "test"
}
stdout {
codec => rubydebug
}
}
[root@rhel6 config]#
然后,就能访问http://192.168.144.230:5601/app/kibana#/dev_tools/console?_g=(),输入如下查询语句:
GET _search
{
"query": {
"match_phrase": {
"message": "wangxi"
}
}
}
查询到我们导入的mongodb日志了: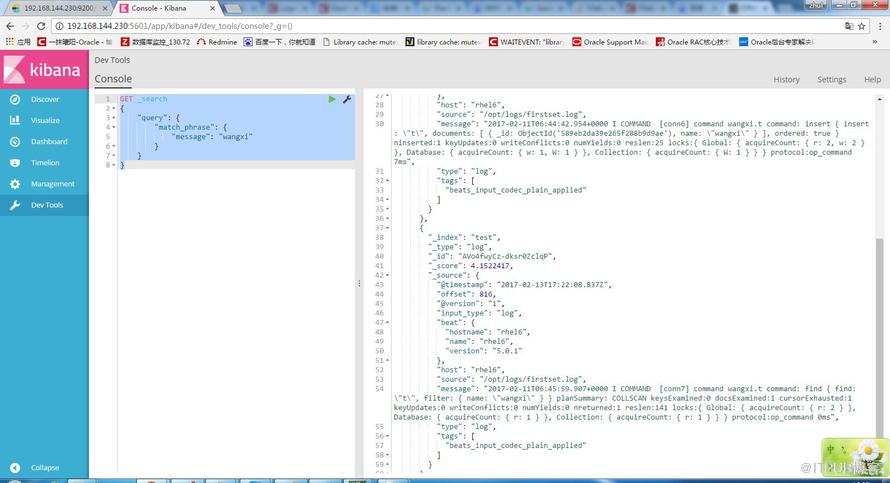
上述内容就是ELK 5.0.1+Filebeat5.0.1 for LINUX RHEL6.6 监控MongoDB日志的示例分析,你们学到知识或技能了吗?如果还想学到更多技能或者丰富自己的知识储备,欢迎关注亿速云行业资讯频道。
免责声明:本站发布的内容(图片、视频和文字)以原创、转载和分享为主,文章观点不代表本网站立场,如果涉及侵权请联系站长邮箱:is@yisu.com进行举报,并提供相关证据,一经查实,将立刻删除涉嫌侵权内容。


