这篇文章将为大家详细讲解有关怎么记录Linux的系统运行时间的统计信息,小编觉得挺实用的,因此分享给大家做个参考,希望大家阅读完这篇文章后可以有所收获。
Linux/Unix 系统管理员对服务器的系统运行时间有一种奇怪的痴迷。这里有一个关于这个主题的 xkcd 漫画,一个好的系统管理员是一股不可阻挡的力量,他伫立在你家猫咪博客的服务器之前,对抗黑暗势力。

Fig.01: Devotion to Duty https://xkcd.com/705/
我们可以使用 uptime 命令或 w 命令 或 top 命令来判断 Linux 系统运行了多久。我可以使用 tuptime 工具保留每次重新启动的运行时间,以获得系统运行时间的历史和统计报告。
这就像 uptime 命令一样,但输出结果更令人印象深刻。最近我发现了另一种称为 uptimed 的工具,用于记录关于机器的系统运行时间和统计信息。让我们看看如何使用 Linux 操作系统上的 uptimed 和 uprecords 来获得运行时间的记录统计信息。
查找系统运行时间非常简单,只需在基于 Linux 的系统上键入以下命令即可:
$ uptime -pup 2 weeks, 4 days, 7 hours, 28 minutes
要保留有关 uptime 的历史统计信息,请使用 tuptime 或 uptimed 工具。
安装 uptimed 的最简单的方式是通过你的软件包管理器,比如 apt/apt-get/yum 这些你的 Linux 发行版的朋友。
键入以下 apt 命令/apt-get 命令:
$ sudo apt-get install uptimed
示例输出:
Reading package lists... DoneBuilding dependency tree Reading state information... DoneThe following additional packages will be installed: libuptimed0The following NEW packages will be installed: libuptimed0 uptimed0 upgraded, 2 newly installed, 0 to remove and 3 not upgraded.Need to get 40.7 kB of archives.After this operation, 228 kB of additional disk space will be used.Do you want to continue? [Y/n] yGet:1 http://mirrors.linode.com/ubuntu xenial/universe amd64 libuptimed0 amd64 1:0.3.17-4 [9,050 B]Get:2 http://mirrors.linode.com/ubuntu xenial/universe amd64 uptimed amd64 1:0.3.17-4 [31.6 kB]Fetched 40.7 kB in 0s (2,738 kB/s) Preconfiguring packages ...Selecting previously unselected package libuptimed0.(Reading database ... 39163 files and directories currently installed.)Preparing to unpack .../libuptimed0_1%3a0.3.17-4_amd64.deb ...Unpacking libuptimed0 (1:0.3.17-4) ...Selecting previously unselected package uptimed.Preparing to unpack .../uptimed_1%3a0.3.17-4_amd64.deb ...Unpacking uptimed (1:0.3.17-4) ...Processing triggers for systemd (229-4ubuntu21) ...Processing triggers for ureadahead (0.100.0-19) ...Processing triggers for man-db (2.7.5-1) ...Setting up libuptimed0 (1:0.3.17-4) ...Setting up uptimed (1:0.3.17-4) ...Processing triggers for libc-bin (2.23-0ubuntu9) ...Processing triggers for systemd (229-4ubuntu21) ...Processing triggers for ureadahead (0.100.0-19) ...
首先 在 CentOS/RHEL 使用 EPEL 仓库:
$ sudo yum -y install epel-release
然后,键入以下 yum 命令:
$ sudo yum install uptimed
示例输出:
Loaded plugins: fastestmirrorLoading mirror speeds from cached hostfile * base: centos.excellmedia.net * epel: ftp.cuhk.edu.hk * extras: centos.excellmedia.net * updates: centos.excellmedia.netResolving Dependencies--> Running transaction check---> Package uptimed.x86_64 0:0.4.0-6.el7 will be installed--> Finished Dependency Resolution Dependencies Resolved =============================================================================== Package Arch Version Repository Size===============================================================================Installing: uptimed x86_64 0.4.0-6.el7 epel 47 k Transaction Summary===============================================================================Install 1 Package Total download size: 47 kInstalled size: 98 kIs this ok [y/d/N]: yDownloading packages:uptimed-0.4.0-6.el7.x86_64.rpm | 47 kB 00:01 Running transaction checkRunning transaction testTransaction test succeededRunning transaction Installing : uptimed-0.4.0-6.el7.x86_64 1/1 Verifying : uptimed-0.4.0-6.el7.x86_64 1/1 Installed: uptimed.x86_64 0:0.4.0-6.el7 Complete!
如果你正在使用 Fedora Linux,运行以下 dnf 命令:
$ sudo dnf install uptimed
键入以下 pacman 命令:
$ sudo pacman -S uptimed
键入以下 emerge 命令:
$ sudo emerge --ask uptimed
使用文本编辑器编辑 /etc/uptimed.conf 文件,例如 vim 命令:
$ sudo vim /etc/uptimed.conf
最少设置一个 email 地址来发送记录。假定有个兼容 sendmail 的 MTA 安装在 /usr/lib/sendmail。
EMAIL=vivek@server1.cyberciti.biz
保存并关闭文件。
使用 systemctl 命令启动 uptimed 服务:
$ sudo systemctl enable uptimed
$ sudo systemctl start uptimed ## start it ##$ sudo systemctl stop uptimed ## stop it ##$ sudo systemctl restart uptimed ## restart it ##$ sudo systemctl status uptimed ## view status ##
示例输出:
● uptimed.service - uptime record daemon Loaded: loaded (/lib/systemd/system/uptimed.service; enabled; vendor preset: enabled) Active: active (running) since Thu 2017-11-09 17:49:14 UTC; 18min ago Main PID: 11137 (uptimed) CGroup: /system.slice/uptimed.service └─11137 /usr/sbin/uptimed -f Nov 09 17:49:14 gfs04 systemd[1]: Started uptime record daemon.
只需键入以下命令即可查看 uptimed(8) 程序的统计信息:
$ uprecords
示例输出:
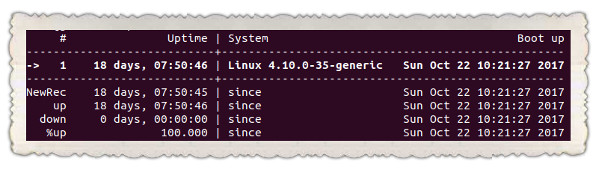
Fig.02: uprecords in action
uprecords 有一些选项:
$ uprecords -?
示例输出:
usage: uprecords [OPTION]... -? this help -a do not print ansi codes -b sort by boottime -B reverse sort by boottime -k sort by sysinfo -K reverse sort by sysinfo -d print downtime seen before every uptimes instead of system -c do not show current entry if not in top entries -f run continously in a loop -s do not print extra statistics -w wide output (more than 80 cols per line) -i INTERVAL use INTERVAL seconds for loop instead of 5, implies -f -m COUNT show a maximum of top COUNT entries instead of 10 -M show next milestone -v version information
关于“怎么记录Linux的系统运行时间的统计信息”这篇文章就分享到这里了,希望以上内容可以对大家有一定的帮助,使各位可以学到更多知识,如果觉得文章不错,请把它分享出去让更多的人看到。
免责声明:本站发布的内容(图片、视频和文字)以原创、转载和分享为主,文章观点不代表本网站立场,如果涉及侵权请联系站长邮箱:is@yisu.com进行举报,并提供相关证据,一经查实,将立刻删除涉嫌侵权内容。


