今天就跟大家聊聊有关Kubernetes的资源指标API及自定义指标API是什么,可能很多人都不太了解,为了让大家更加了解,小编给大家总结了以下内容,希望大家根据这篇文章可以有所收获。
以前是用heapster来收集资源指标才能看,现在heapster要废弃了
从1.8以后引入了资源api指标监视
资源指标:metrics-server(核心指标)
自定义指标:prometheus,k8s-prometheus-adapter(将Prometheus采集的数据转换为指标格式)
k8s的中的prometheus需要k8s-prometheus-adapter转换一下才可以使用
新一代架构:
核心指标流水线:
kubelet,metrics-service以及API service提供api组成;cpu累计使用率,内存实时使用率,pod的资源占用率和容器磁盘占用率;
监控流水线:
用于从系统收集各种指标数据并提供终端用户,存储系统以及HPA,他们包括核心指标以及很多非核心指标,非核心指标本身不能被k8s解析
复制代码
第二章、安装部署metrics-server
1、下载yaml文件,并安装
项目地址:https://github.com/kubernetes/kubernetes/tree/master/cluster/addons/metrics-server ,选择与版本对应的分支,我的是v1.10.0,所以这里我选择v1.10.0分支
[root@k8s-master_01 manifests]# mkdir metrics-server
[root@k8s-master_01 manifests]# cd metrics-server
[root@k8s-master_01 metrics-server]# for file in auth-delegator.yaml auth-reader.yaml metrics-apiservice.yaml metrics-server-deployment.yaml metrics-server-service.yaml resource-reader.yaml;do wget https://raw.githubusercontent.com/kubernetes/kubernetes/v1.10.0/cluster/addons/metrics-server/$file;done   #记住,下载raw格式的文件
[root@k8s-master_01 metrics-server]# grep image: ./*  #查看使用的镜像,如果可以上外网,那么忽略,如果不可用那么需要提前下载,通过修改配置文件或修改镜像的名称的方式加载镜像,镜像可以到阿里云上去搜索
./metrics-server-deployment.yaml:        image: k8s.gcr.io/metrics-server-amd64:v0.2.1
./metrics-server-deployment.yaml:        image: k8s.gcr.io/addon-resizer:1.8.1
[root@k8s-node_01 ~]# docker pull registry.cn-hangzhou.aliyuncs.com/criss/addon-resizer:1.8.1  #手动在所有的node节点上下载镜像,注意版本号没有v
[root@k8s-node_01 ~]# docker pull registry.cn-hangzhou.aliyuncs.com/k8s-kernelsky/metrics-server-amd64:v0.2.1
[root@k8s-master_01 metrics-server]# grep image: metrics-server-deployment.yaml
        image: registry.cn-hangzhou.aliyuncs.com/k8s-kernelsky/metrics-server-amd64:v0.2.1
        image: registry.cn-hangzhou.aliyuncs.com/criss/addon-resizer:1.8.1
[root@k8s-master_01 metrics-server]# kubectl apply -f .
[root@k8s-master_01 metrics-server]# kubectl get pod -n kube-system
2、验证
[root@k8s-master01 ~]# kubectl api-versions |grep metrics
metrics.k8s.io/v1beta1
[root@k8s-node01 ~]# kubectl proxy --port=8080  #重新打开一个终端,启动代理功能
[root@k8s-master_01 metrics-server]# curl http://localhost:8080/apis/metrics.k8s.io/v1beta1 #查看这个资源组包含哪些组件
[root@k8s-master_01 metrics-server]# curl http://localhost:8080/apis/metrics.k8s.io/v1beta1/pods  #可能需要等待一会在会有数据
[root@k8s-master_01 metrics-server]# curl http://localhost:8080/apis/metrics.k8s.io/v1beta1/nodes
[root@k8s-node01 ~]# kubectl top node
NAME           CPU(cores)   CPU%      MEMORY(bytes)   MEMORY%
k8s-master01   176m         4%        3064Mi          39%
k8s-node01     62m          1%        4178Mi          54%
k8s-node02     65m          1%        2141Mi          27%
[root@k8s-node01 ~]# kubectl top pods
NAME                CPU(cores)   MEMORY(bytes)
node-affinity-pod   0m           1Mi
3.注意事项
1.#在更新的版本中,如v1.11及以上会出现问题,这是因为metric-service默认从kubernetes的summary_api中获取数据,而summary_api默认使用10255端口来获
取数据,但是10255是一个http协议的端口,可能官方认为http协议不安全所以封禁了10255端口改为使用10250端口,而10250是一个https协议端口,所以我们需要修改一下连接方式:
由  - --source=kubernetes.summary_api:''
修改为  - --source=kubernetes.summary_api:https://kubernetes.default?kubeletHttps=true&kubeletPort=10250&insecure-true  #表示虽然我使用https协议来通信,并且端口也是10250,但是如果证书不能认证依然可以通过非安全不加密的方式来通信
[root@k8s-node01 deploy]# grep source=kubernetes  metrics-server-deployment.yaml
2.[root@k8s-node01 deploy]# grep nodes/stats  resource-reader.yaml #在新的版本中,授权文内没有 node/stats 的权限,需要手动去添加
[root@k8s-node01 deploy]# cat resource-reader.yaml
apiVersion: rbac.authorization.k8s.io/v1
kind: ClusterRole
metadata:
  name: system:metrics-server
rules:
- apiGroups:
  - ""
  resources:
  - pods
  - nodes
  - nodes/stats  #添加这一行
  - namespaces
3.在1.12.3版本中测试发现,需要进行如下修改才能成功部署(权限依然需要修改,其他版本暂未测试)
[root@k8s-master-01 metrics-server]# vim metrics-server-deployment.yaml
command:   #metrics-server命令参数修改为如下参数
  - /metrics-server
  - --metric-resolution=30s
  - --kubelet-port=10250
  - --kubelet-insecure-tls
  - --kubelet-preferred-address-types=InternalIP
command:    #metrics-server-nanny 命令参数修改为如下参数
  - /pod_nanny
  - --config-dir=/etc/config
  - --cpu=40m
  - --extra-cpu=0.5m
  - --memory=40Mi
  - --extra-memory=4Mi
  - --threshold=5
  - --deployment=metrics-server-v0.3.1
  - --container=metrics-server
  - --poll-period=300000
  - --estimator=exponential
第三章、安装部署prometheus
项目地址:https://github.com/kubernetes/kubernetes/tree/master/cluster/addons/prometheus(由于prometheus只有v1.11.0及以上才有,所有我选择v1.11.0来部署)
1.下载yaml文件及部署前操作
[root@k8s-node01 ~]# cd /mnt/
[root@k8s-node01 mnt]# git clone https://github.com/kubernetes/kubernetes.git  #我嫌麻烦就直接克隆kubernetes整个项目了
[root@k8s-node01 mnt]# cd kubernetes/cluster/addons/prometheus/
[root@k8s-node01 prometheus]# git checkout v1.11.0
[root@k8s-node01 prometheus]# cd ..
[root@k8s-node01 addons]# cp -r prometheus /root/manifests/
[root@k8s-node01 manifests]# cd prometheus/
[root@k8s-node01 prometheus]# grep -w  "namespace: kube-system" ./*   #默认prometheus使用的是kube-system名称空间,我们把它单独部署到一个名称空间中,方便之后的管理
./alertmanager-configmap.yaml:  namespace: kube-system
......
[root@k8s-node01 prometheus]# sed  -i 's/namespace: kube-system/namespace\: k8s-monitor/g' ./*
[root@k8s-node01 prometheus]# grep storage: ./*   #安装需要两个pv,等下我们需要创建一下
./alertmanager-pvc.yaml:      storage: "2Gi"
./prometheus-statefulset.yaml:          storage: "16Gi"
[root@k8s-node01 prometheus]# cat pv.yaml #注意第二pv的storageClassName
apiVersion: v1
kind: PersistentVolume
metadata:
  name: alertmanager
spec:
  capacity:
    storage: 5Gi
  accessModes:
    - ReadWriteOnce
    - ReadWriteMany
  persistentVolumeReclaimPolicy: Recycle
  nfs:
    path: /data/volumes/v1
    server: 172.16.150.158
---
apiVersion: v1
kind: PersistentVolume
metadata:
  name: standard
spec:
  capacity:
    storage: 25Gi
  accessModes:
    - ReadWriteOnce
  persistentVolumeReclaimPolicy: Recycle
  storageClassName: standard   #storageClassName与prometheus-statefulset.yaml中volumeClaimTemplates下定义的需要保持一致
  nfs:
    path: /data/volumes/v2
    server: 172.16.150.158
[root@k8s-node01 prometheus]# kubectl create namespace k8s-monitor
[root@k8s-node01 prometheus]# mkdir node-exporter kube-state-metrics alertmanager prometheus #将每个组件单独放入一个目录中,方便部署及管理
[root@k8s-node01 prometheus]# mv node-exporter-* node-exporter
[root@k8s-node01 prometheus]# mv alertmanager-* alertmanager
[root@k8s-node01 prometheus]# mv kube-state-metrics-* kube-state-metrics
[root@k8s-node01 prometheus]# mv prometheus-* prometheus
2.安装node-exporter(用于收集节点的数据指标)
[root@k8s-node01 prometheus]# grep -r image:  node-exporter/*
node-exporter/node-exporter-ds.yml:          image: "prom/node-exporter:v0.15.2"   #非官方镜像,不能上外网的也可以下载,所以不需要提前下载
[root@k8s-node01 prometheus]# kubectl apply -f node-exporter/
daemonset.extensions "node-exporter" created
service "node-exporter" created
[root@k8s-node01 prometheus]# kubectl get pod -n k8s-monitor
NAME                  READY     STATUS    RESTARTS   AGE
node-exporter-l5zdw   1/1       Running   0          1m
node-exporter-vwknx   1/1       Running   0          1m
3.安装prometheus
[root@k8s-master_01 prometheus]# kubectl apply -f pv.yaml
persistentvolume "alertmanager" configured
persistentvolume "standard" created
[root@k8s-master_01 prometheus]# kubectl get pv
NAME              CAPACITY   ACCESS MODES   RECLAIM POLICY   STATUS      CLAIM     STORAGECLASS   REASON    AGE
alertmanager      5Gi        RWO,RWX        Recycle          Available                                      9s
standard          25Gi       RWO            Recycle          Available                                      9s
[root@k8s-node01 prometheus]# grep -i image prometheus/*  #查看镜像是否需要下载
[root@k8s-node01 prometheus]# vim prometheus-service.yaml   #默认prometheus的service端口类型为ClusterIP,为了可以集群外访问,修改为NodePort
...
  type: NodePort
  ports:
    - name: http
      port: 9090
      protocol: TCP
      targetPort: 9090
      nodePort: 30090
...
[root@k8s-node01 prometheus]# kubectl apply -f prometheus/
[root@k8s-node01 prometheus]# kubectl get pod -n k8s-monitor
NAME                  READY     STATUS    RESTARTS   AGE
node-exporter-l5zdw   1/1       Running   0          24m
node-exporter-vwknx   1/1       Running   0          24m
prometheus-0          2/2       Running   0          1m
[root@k8s-node01 prometheus]# kubectl get svc -n k8s-monitor
NAME            TYPE        CLUSTER-IP    EXTERNAL-IP   PORT(S)          AGE
node-exporter   ClusterIP   None          <none>        9100/TCP         25m
prometheus      NodePort    10.96.9.121   <none>        9090:30090/TCP   22m
[root@k8s-master_01 prometheus]# kubectl get pv
NAME           CAPACITY   ACCESS MODES   RECLAIM POLICY   STATUS      CLAIM                                      STORAGECLASS   REASON    AGE
alertmanager   5Gi        RWO,RWX        Recycle          Available                                                                       1h
standard       25Gi       RWO            Recycle          Bound       k8s-monitor/prometheus-data-prometheus-0   standard                 1h
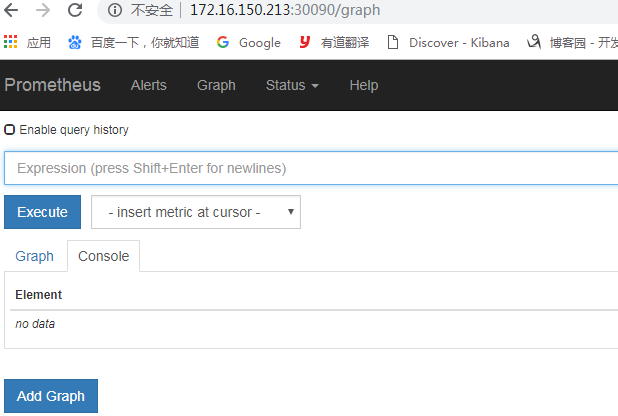
访问prometheus(node节点IP:端口)
4.部署metrics适配器(将prometheus数据转换为k8s可以识别的数据)
[root@k8s-node01 kube-state-metrics]# grep image: ./*
./kube-state-metrics-deployment.yaml:        image: quay.io/coreos/kube-state-metrics:v1.3.0
./kube-state-metrics-deployment.yaml:        image: k8s.gcr.io/addon-resizer:1.7
[root@k8s-node02 ~]#  docker pull registry.cn-hangzhou.aliyuncs.com/ccgg/addon-resizer:1.7
[root@k8s-node01 kube-state-metrics]# vim kube-state-metrics-deployment.yaml   #修改镜像地址
[root@k8s-node01 kube-state-metrics]# kubectl apply -f kube-state-metrics-deployment.yaml
deployment.extensions "kube-state-metrics" configured
[root@k8s-node01 kube-state-metrics]# kubectl get pod -n k8s-monitor
NAME                                  READY     STATUS    RESTARTS   AGE
kube-state-metrics-54849b96b4-dmqtk   2/2       Running   0          23s
node-exporter-l5zdw                   1/1       Running   0          2h
node-exporter-vwknx                   1/1       Running   0          2h
prometheus-0                          2/2       Running   0          1h
5.部署k8s-prometheus-adapter(将数据输出为一个API服务)
项目地址:https://github.com/DirectXMan12/k8s-prometheus-adapter
[root@k8s-master01 ~]# cd /etc/kubernetes/pki/
[root@k8s-master01 pki]#(umask 077; openssl genrsa -out serving.key 2048)
[root@k8s-master01 pki]#openssl req -new -key serving.key -out serving.csr -subj "/CN=serving"  #CN必须为serving
[root@k8s-master01 pki]#openssl x509 -req -in serving.csr -CA ./ca.crt -CAkey ./ca.key  -CAcreateserial -out serving.crt -days 3650
[root@k8s-master01 pki]# kubectl create secret generic cm-adapter-serving-certs --from-file=serving.crt=./serving.crt --from-file=serving.key=./serving.key -n k8s-monitor #证书名称必须为cm-adapter-serving-certs
[root@k8s-master01 pki]#kubectl get secret  -n k8s-monitor
[root@k8s-master01 pki]# cd
[root@k8s-node01 ~]# git clone https://github.com/DirectXMan12/k8s-prometheus-adapter.git
[root@k8s-node01 ~]# cd k8s-prometheus-adapter/deploy/manifests/
[root@k8s-node01 manifests]# grep namespace: ./* #处理role-binding之外的namespace的名称改为k8s-monitor
[root@k8s-node01 manifests]# grep image: ./* #镜像不需要下载
[root@k8s-node01 ~]# sed -i 's/namespace\: custom-metrics/namespace\: k8s-monitor/g' ./*   #rolebinding的不要替换
[root@k8s-node01 ~]# kubectl apply -f ./
[root@k8s-node01 ~]# kubectl get pod -n k8s-monitor
[root@k8s-node01 ~]#kubectl get svc -n k8s-monitor
kubectl api-versions |grep custom
第四章、部署prometheus+grafana
[root@k8s-master01 ~]# wget https://raw.githubusercontent.com/kubernetes-retired/heapster/master/deploy/kube-config/influxdb/grafana.yaml #找不到grafana的yaml文件,所以到heapster里面掏了一个下来用用
[root@k8s-master01 ~]#egrep -i "influxdb|namespace|nodeport" grafana.yaml  #注释掉influxdb环境变量,修改namespace及port类型
[root@k8s-master01 ~]#kubectl apply -f grafana.yaml
[root@k8s-master01 ~]#kubectl get svc  -n k8s-monitor
[root@k8s-master01 ~]#kubectl get pod -n k8s-monitor
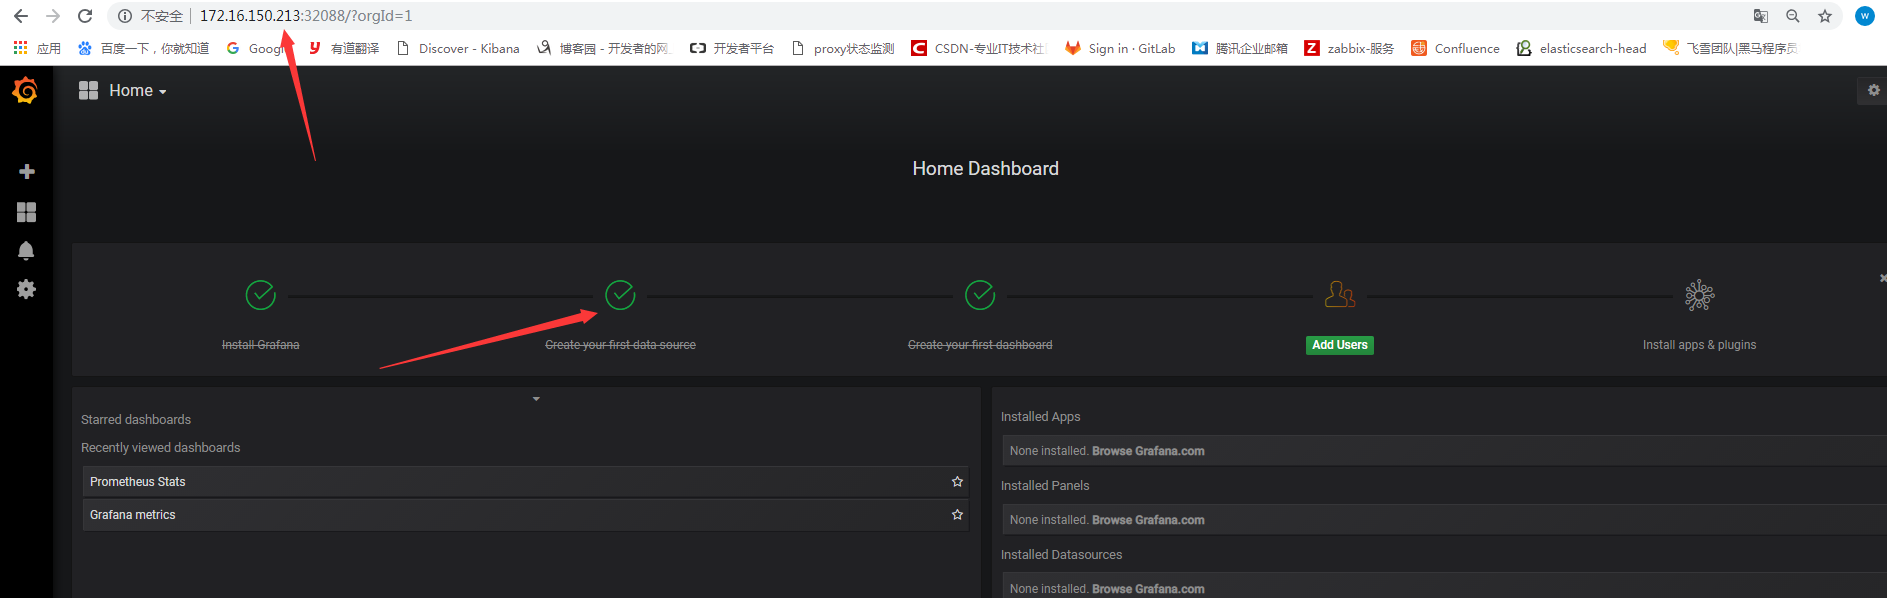
登录grafana,并修改数据源
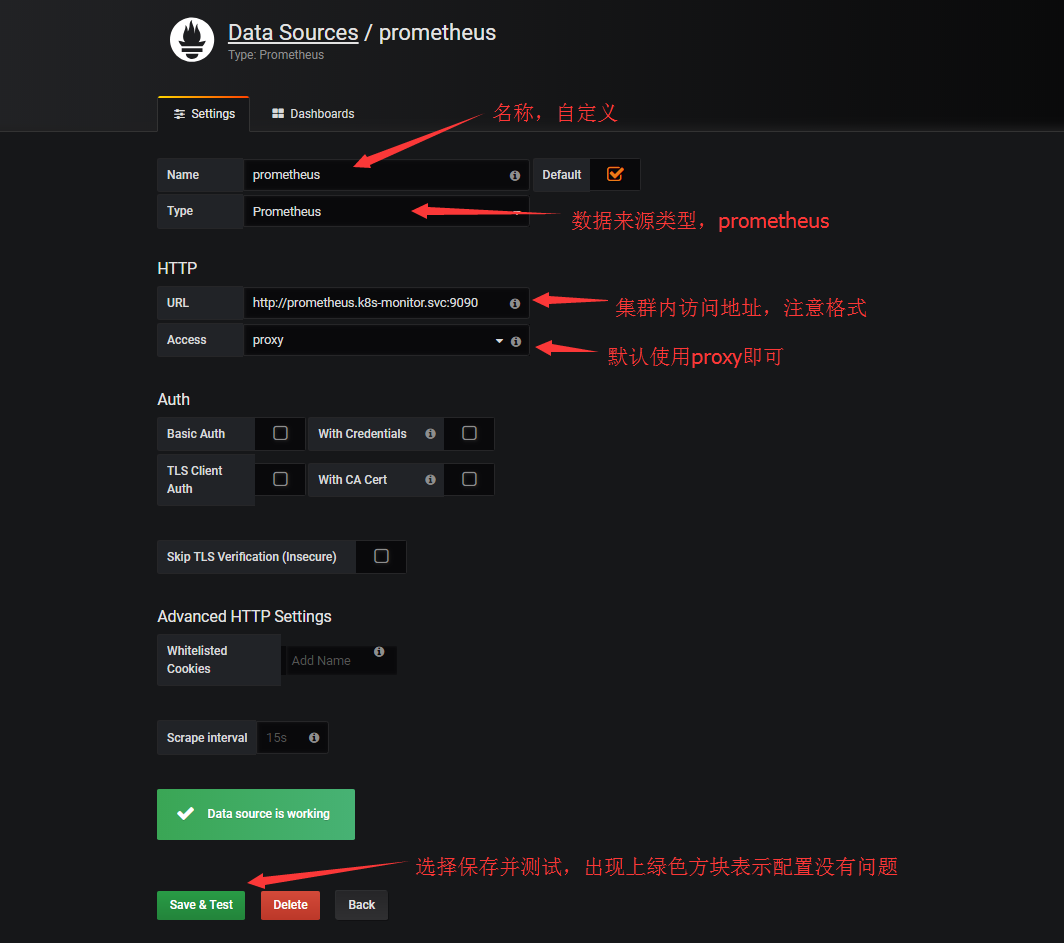
配置数据源
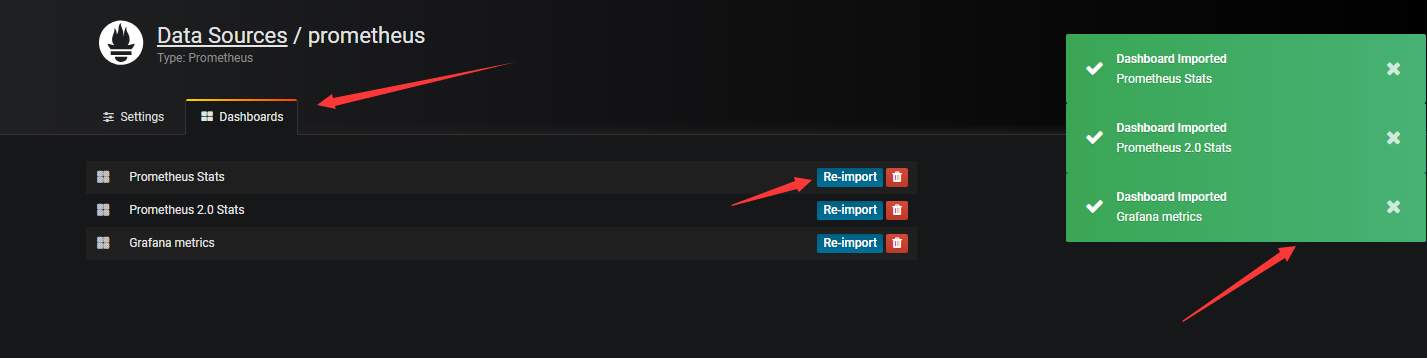
点击右侧的Dashborads,可以导入grafana自带的prometheus的模板
回到home下,下拉选择对应的模板查看数据
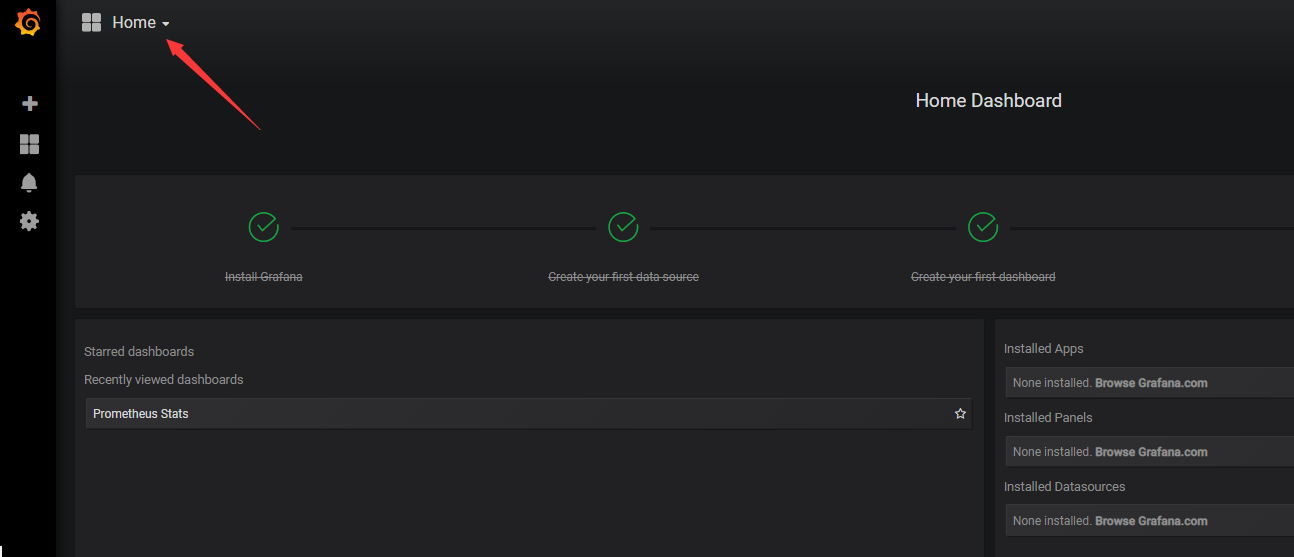
例如:
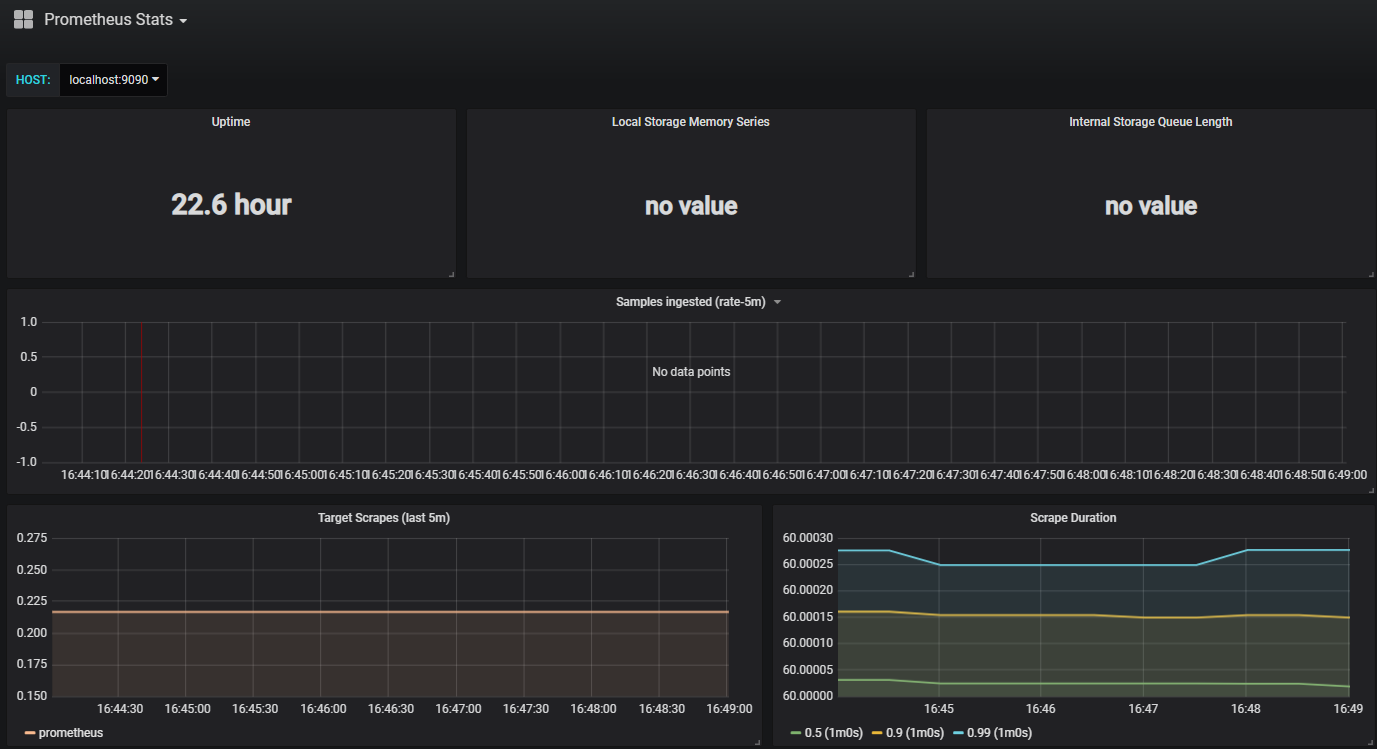 但是,grafana自带的模板和数据有些不匹配,我们可以去grafana官网去下载应用于k8s使用的模板,地址为:https://grafana.com/dashboards
访问grafana官网搜索k8s相关模板,有时搜索框点击没有反应,可以直接在URL后面加上搜索内容即可
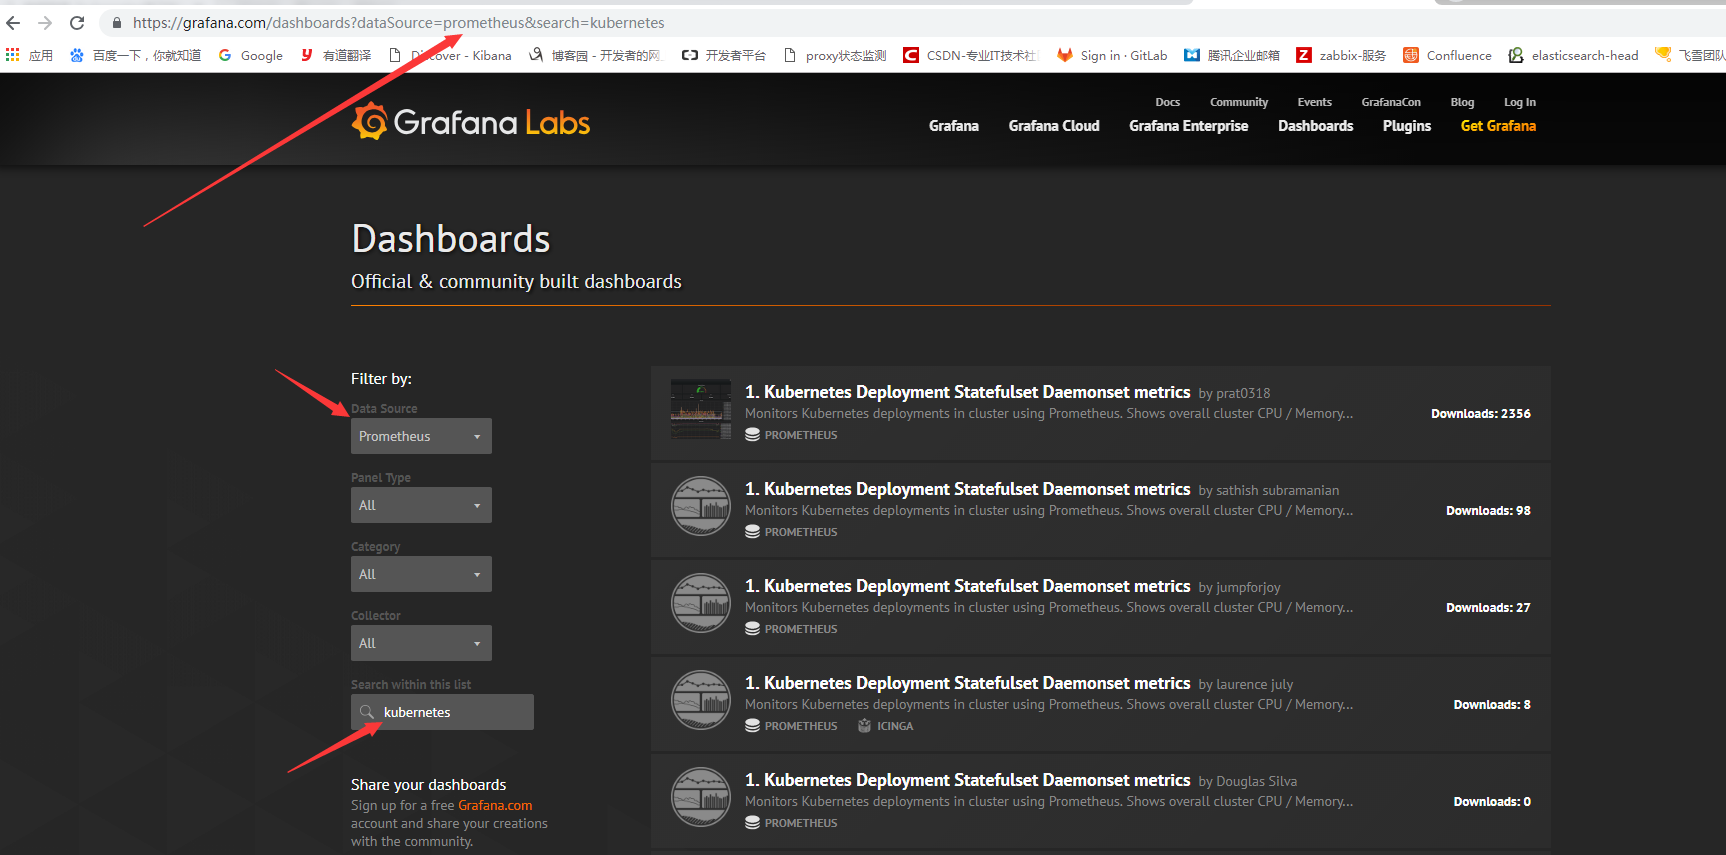
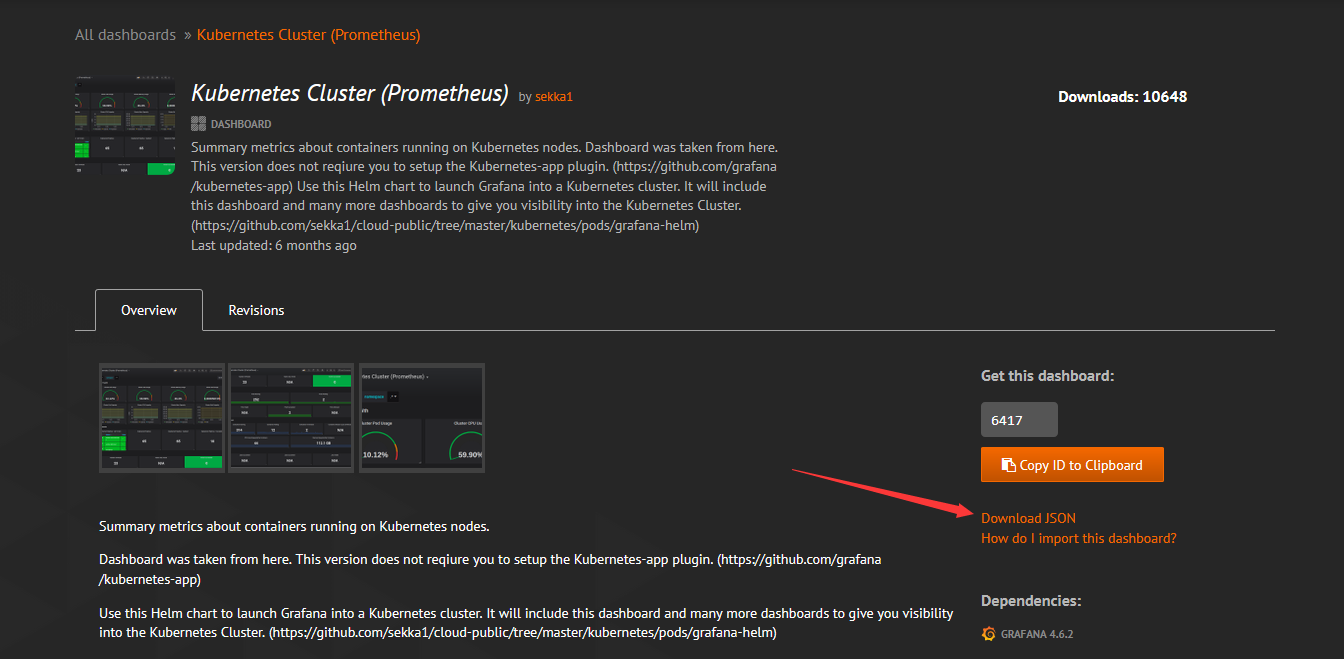
我们选择kubernetes cluster(prometheus)作为测试
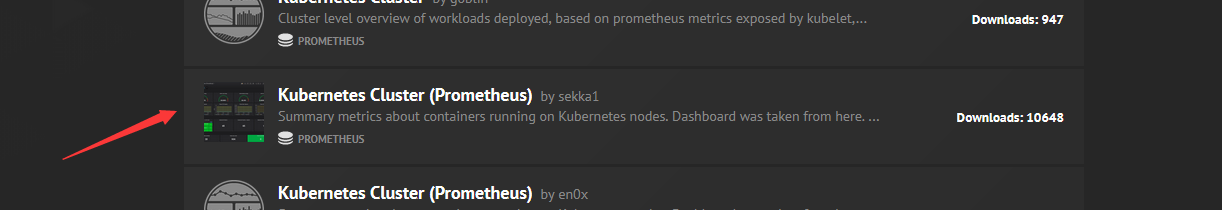 点击需要下载的模板,并下载json文件
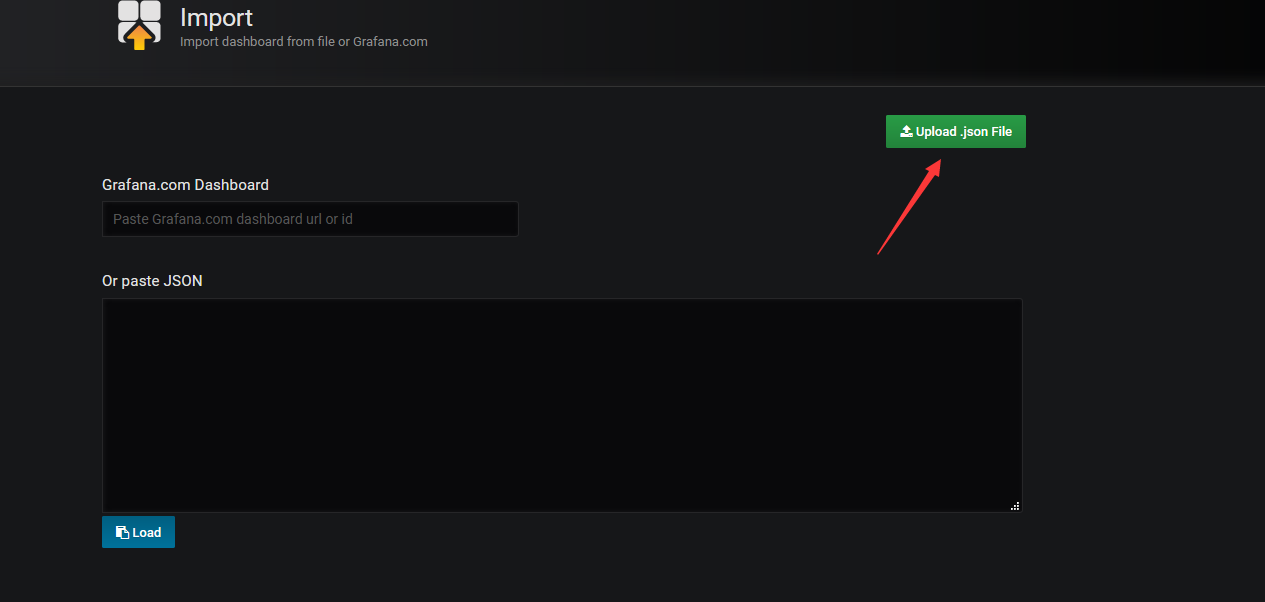
下载完成后,导入文件
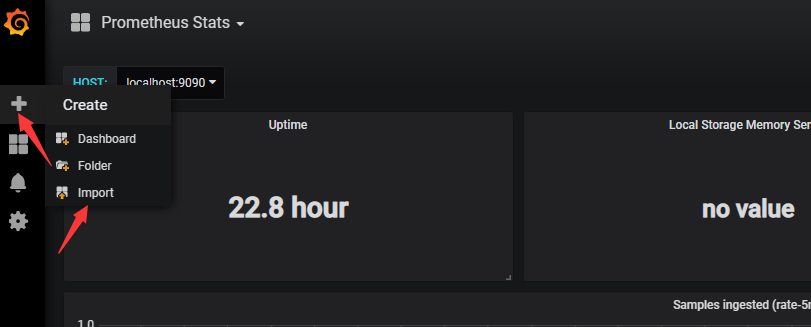
选择上传文件
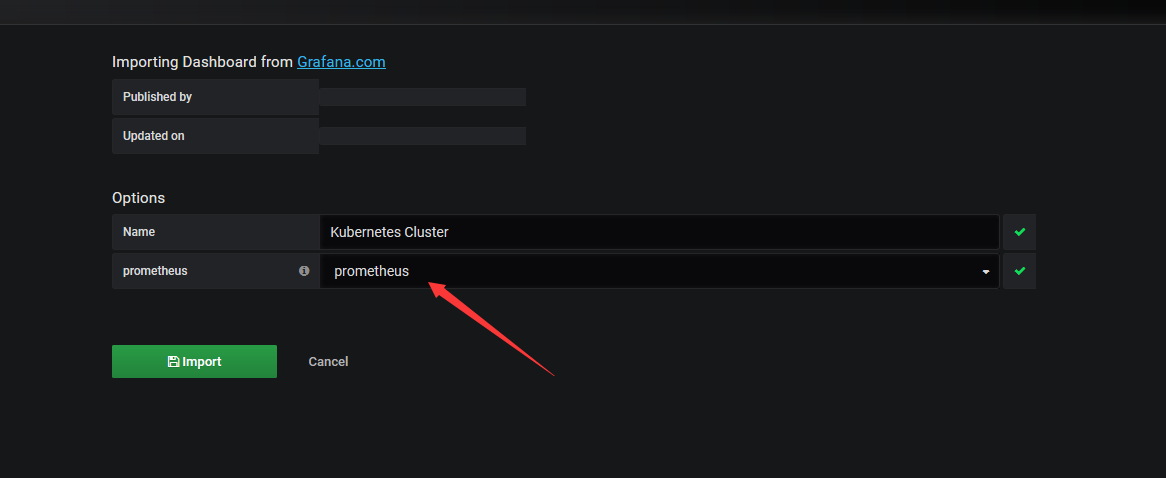
导入后选择数据源
导入后展示的界面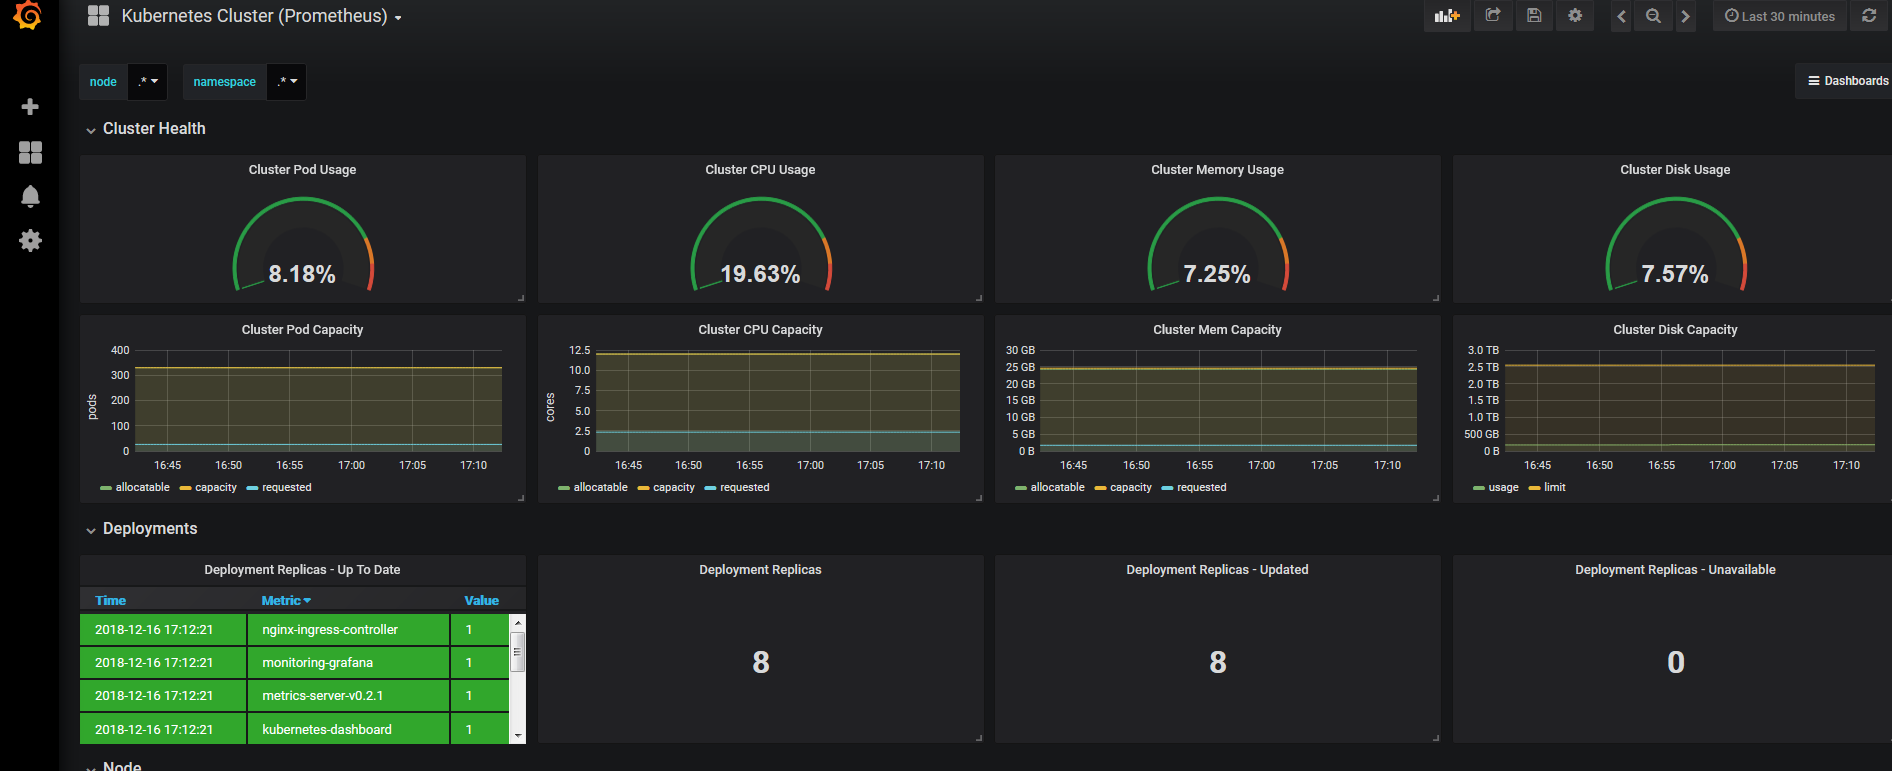
第五章、实现HPA
1、使用v1版本测试
[root@k8s-master01 alertmanager]# kubectl api-versions |grep autoscaling
autoscaling/v1
autoscaling/v2beta1
[root@k8s-master01 manifests]# cat deploy-demon.yaml
apiVersion: v1
kind: Service
metadata:
  name: myapp
  namespace: default
spec:
  selector:
    app: myapp
  type: NodePort
  ports:
  - name: http
    port: 80
    targetPort: 80
    nodePort: 32222
---
apiVersion: apps/v1
kind: Deployment
metadata:
  name: myapp-deploy
spec:
  replicas: 2
  selector:
    matchLabels:
      app: myapp
  template:
    metadata:
      labels:
        app: myapp
    spec:
      containers:
      - name: myapp
        image: ikubernetes/myapp:v2
        ports:
        - name: httpd
          containerPort: 80
        resources:
          requests:
            memory: "64Mi"
            cpu: "100m"
          limits:
            memory: "128Mi"
            cpu: "200m"
[root@k8s-master01 manifests]# kubectl get svc
NAME         TYPE        CLUSTER-IP      EXTERNAL-IP   PORT(S)             AGE
kubernetes   ClusterIP   10.96.0.1       <none>        443/TCP             47d
my-nginx     NodePort    10.104.13.148   <none>        80:32008/TCP        19d
myapp        NodePort    10.100.76.180   <none>        80:32222/TCP        16s
tomcat       ClusterIP   10.106.222.72   <none>        8080/TCP,8009/TCP   19d
[root@k8s-master01 manifests]# kubectl get pod
NAME                            READY     STATUS    RESTARTS   AGE
myapp-deploy-5db497dbfb-h7zcb   1/1       Running   0          16s
myapp-deploy-5db497dbfb-tvsf5   1/1       Running   0          16s
测试
[root@k8s-master01 manifests]# kubectl autoscale deployment myapp-deploy --min=1 --max=8 --cpu-percent=60
deployment.apps "myapp-deploy" autoscaled
[root@k8s-master01 manifests]# kubectl get hpa
NAME           REFERENCE                 TARGETS         MINPODS   MAXPODS   REPLICAS   AGE
myapp-deploy   Deployment/myapp-deploy   <unknown>/60%   1         8         0          22s
[root@k8s-master01 pod-dir]# yum install http-tools -y
[root@k8s-master01 pod-dir]# ab -c 1000 -n 5000000 http://172.16.150.213:32222/index.html
[root@k8s-master01 ~]# kubectl describe hpa
Name:                                                  myapp-deploy
Namespace:                                             default
Labels:                                                <none>
Annotations:                                           <none>
CreationTimestamp:                                     Sun, 16 Dec 2018 20:34:41 +0800
Reference:                                             Deployment/myapp-deploy
Metrics:                                               ( current / target )
  resource cpu on pods  (as a percentage of request):  178% (178m) / 60%
Min replicas:                                          1
Max replicas:                                          8
Conditions:
  Type            Status  Reason            Message
  ----            ------  ------            -------
  AbleToScale     False   BackoffBoth       the time since the previous scale is still within both the downscale and upscale forbidden windows
  ScalingActive   True    ValidMetricFound  the HPA was able to successfully calculate a replica count from cpu resource utilization (percentage of request)
  ScalingLimited  True    ScaleUpLimit      the desired replica count is increasing faster than the maximum scale rate
Events:
  Type    Reason             Age   From                       Message
  ----    ------             ----  ----                       -------
  Normal  SuccessfulRescale  19m   horizontal-pod-autoscaler  New size: 1; reason: All metrics below target
  Normal  SuccessfulRescale  2m    horizontal-pod-autoscaler  New size: 2; reason: cpu resource utilization (percentage of request) above target
[root@k8s-master01 ~]# kubectl get pod
NAME                            READY     STATUS    RESTARTS   AGE
myapp-deploy-5db497dbfb-6kssf   1/1       Running   0          2m
myapp-deploy-5db497dbfb-h7zcb   1/1       Running   0          24m
[root@k8s-master01 ~]# kubectl get hpa
NAME           REFERENCE                 TARGETS    MINPODS   MAXPODS   REPLICAS   AGE
myapp-deploy   Deployment/myapp-deploy   178%/60%   1         8         2          20m
2、使用v2beat1
[root@k8s-master01 pod-dir]# cat hpa-demo.yaml
apiVersion: autoscaling/v2beta1
kind: HorizontalPodAutoscaler
metadata:
  name: myapp-hpa-v2
spec:
  scaleTargetRef:
    apiVersion: apps/v1
    kind: Deployment
    name: myapp-deploy
  minReplicas: 1
  maxReplicas: 10
  metrics:
  - type: Resource
    resource:
      name: cpu
      targetAverageUtilization: 55
  - type: Resource
    resource:
      name: memory
      targetAverageValue: 100Mi
[root@k8s-master01 pod-dir]# kubectl delete hpa myapp-deploy
horizontalpodautoscaler.autoscaling "myapp-deploy" deleted
[root@k8s-master01 pod-dir]# kubectl apply -f hpa-demo.yaml
horizontalpodautoscaler.autoscaling "myapp-hpa-v2" created
[root@k8s-master01 pod-dir]# kubectl get hpa
NAME           REFERENCE                 TARGETS                          MINPODS   MAXPODS   REPLICAS   AGE
myapp-hpa-v2   Deployment/myapp-deploy   <unknown>/100Mi, <unknown>/55%   1         10        0          6s
测试
[root@k8s-master01 ~]# kubectl describe hpa
Name:                                                  myapp-hpa-v2
Namespace:                                             default
Labels:                                                <none>
Annotations:                                           kubectl.kubernetes.io/last-applied-configuration={"apiVersion":"autoscaling/v2beta1","kind":"HorizontalPodAutoscaler","metadata":{"annotations":{},"name":"myapp-hpa-v2","namespace":"default"},"spec":{...
CreationTimestamp:                                     Sun, 16 Dec 2018 21:07:25 +0800
Reference:                                             Deployment/myapp-deploy
Metrics:                                               ( current / target )
  resource memory on pods:                             1765376 / 100Mi
  resource cpu on pods  (as a percentage of request):  200% (200m) / 55%
Min replicas:                                          1
Max replicas:                                          10
Conditions:
  Type            Status  Reason              Message
  ----            ------  ------              -------
  AbleToScale     True    SucceededRescale    the HPA controller was able to update the target scale to 4
  ScalingActive   True    ValidMetricFound    the HPA was able to successfully calculate a replica count from cpu resource utilization (percentage of request)
  ScalingLimited  False   DesiredWithinRange  the desired count is within the acceptable range
Events:
  Type    Reason             Age   From                       Message
  ----    ------             ----  ----                       -------
  Normal  SuccessfulRescale  18s   horizontal-pod-autoscaler  New size: 4; reason: cpu resource utilization (percentage of request) above target
[root@k8s-master01 ~]# kubectl get pod
NAME                            READY     STATUS    RESTARTS   AGE
myapp-deploy-5db497dbfb-5n885   1/1       Running   0          26s
myapp-deploy-5db497dbfb-h7zcb   1/1       Running   0          40m
myapp-deploy-5db497dbfb-z2tqd   1/1       Running   0          26s
myapp-deploy-5db497dbfb-zkjhw   1/1       Running   0          26s
[root@k8s-master01 ~]# kubectl describe hpa
Name:                                                  myapp-hpa-v2
Namespace:                                             default
Labels:                                                <none>
Annotations:                                           kubectl.kubernetes.io/last-applied-configuration={"apiVersion":"autoscaling/v2beta1","kind":"HorizontalPodAutoscaler","metadata":{"annotations":{},"name":"myapp-hpa-v2","namespace":"default"},"spec":{...
CreationTimestamp:                                     Sun, 16 Dec 2018 21:07:25 +0800
Reference:                                             Deployment/myapp-deploy
Metrics:                                               ( current / target )
  resource memory on pods:                             1765376 / 100Mi
  resource cpu on pods  (as a percentage of request):  0% (0) / 55%
Min replicas:                                          1
Max replicas:                                          10
Conditions:
  Type            Status  Reason              Message
  ----            ------  ------              -------
  AbleToScale     False   BackoffBoth         the time since the previous scale is still within both the downscale and upscale forbidden windows
  ScalingActive   True    ValidMetricFound    the HPA was able to successfully calculate a replica count from memory resource
  ScalingLimited  False   DesiredWithinRange  the desired count is within the acceptable range
Events:
  Type    Reason             Age   From                       Message
  ----    ------             ----  ----                       -------
  Normal  SuccessfulRescale  6m    horizontal-pod-autoscaler  New size: 4; reason: cpu resource utilization (percentage of request) above target
  Normal  SuccessfulRescale  34s   horizontal-pod-autoscaler  New size: 1; reason: All metrics below target
[root@k8s-master01 ~]# kubectl get pod
NAME                            READY     STATUS    RESTARTS   AGE
myapp-deploy-5db497dbfb-h7zcb   1/1       Running   0          46m
3.使用v2beat1测试自定义选项
[root@k8s-master01 pod-dir]# cat  ../deploy-demon-metrics.yaml
apiVersion: v1
kind: Service
metadata:
  name: myapp
  namespace: default
spec:
  selector:
    app: myapp
  type: NodePort
  ports:
  - name: http
    port: 80
    targetPort: 80
    nodePort: 32222
---
apiVersion: apps/v1
kind: Deployment
metadata:
  name: myapp-deploy
spec:
  replicas: 2
  selector:
    matchLabels:
      app: myapp
  template:
    metadata:
      labels:
        app: myapp
    spec:
      containers:
      - name: myapp
        image: ikubernetes/metrics-app  #测试镜像
        ports:
        - name: httpd
          containerPort: 80
[root@k8s-master01 pod-dir]# kubectl apply -f deploy-demon-metrics.yaml
[root@k8s-master01 pod-dir]# cat hpa-custom.yaml
apiVersion: autoscaling/v2beta1
kind: HorizontalPodAutoscaler
metadata:
  name: myapp-hpa-v2
spec:
  scaleTargetRef:
    apiVersion: apps/v1
    kind: Deployment
    name: myapp-deploy
  minReplicas: 1
  maxReplicas: 10
  metrics:
  - type: Pods   #注意类型
    pods:
      metricName: http_requests #容器中自定义的参数
      targetAverageValue: 800m  #m表示个数,即800个并发数
[root@k8s-master01 pod-dir]# kubectl apply -f hpa-custom.yaml
[root@k8s-master01 pod-dir]# kubectl describe hpa myapp-hpa-v2
Name:                       myapp-hpa-v2
Namespace:                  default
Labels:                     <none>
Annotations:                kubectl.kubernetes.io/last-applied-configuration={"apiVersion":"autoscaling/v2beta1","ks":{},"name":"myapp-hpa-v2","namespace":"default"},"spec":{...
CreationTimestamp:          Sun, 16 Dec 2018 22:09:32 +0800
Reference:                  Deployment/myapp-deploy
Metrics:                    ( current / target )
  "http_requests" on pods:  <unknown> / 800m
Min replicas:               1
Max replicas:               10
Events:                     <none>
[root@k8s-master01 pod-dir]# kubectl get hpa
NAME           REFERENCE                 TARGETS          MINPODS   MAXPODS   REPLICAS   AGE
myapp-hpa-v2   Deployment/myapp-deploy   <unknown>/800m   1         10        2          5m
看完上述内容,你们对Kubernetes的资源指标API及自定义指标API是什么有进一步的了解吗?如果还想了解更多知识或者相关内容,请关注亿速云行业资讯频道,感谢大家的支持。
免责声明:本站发布的内容(图片、视频和文字)以原创、转载和分享为主,文章观点不代表本网站立场,如果涉及侵权请联系站长邮箱:is@yisu.com进行举报,并提供相关证据,一经查实,将立刻删除涉嫌侵权内容。


