第一步:安装filebeat
参考:https://www.elastic.co/guide/en/beats/filebeat/current/filebeat-installation.html
第二步:filebeat目录说明
Type                  Description                                                                 Location
home                 Home of the Filebeat installation.                             {extract.path}
bin                   The location for the binary files.                                {extract.path}
config              The location for configuration files.                           {extract.path}
data                   The location for persistent data files.                      {extract.path}/data
logs                    The location for the logs created by Filebeat.         {extract.path}/logs
第三步:filebeat配置
默认配置文件为filebeat.yml
内容为:
###################### Filebeat Configuration Example #########################
#This file is an example configuration file highlighting only the most common
#options. The filebeat.reference.yml file from the same directory contains all the
#supported options with more comments. You can use it as a reference.
#You can find the full configuration reference here:
https://www.elastic.co/guide/en/beats/filebeat/index.html
#For more available modules and options, please see the filebeat.reference.yml sample
#configuration file.
#=========================== Filebeat inputs =============================
filebeat.inputs:
#Each - is an input. Most options can be set at the input level, so
#you can use different inputs for various configurations.
#Below are the input specific configurations.
type: log
#Change to true to enable this input configuration.
enabled: false
#Paths that should be crawled and fetched. Glob based paths.
paths:
#Exclude lines. A list of regular expressions to match. It drops the lines that are
#matching any regular expression from the list.
#exclude_lines: ['^DBG']
#Include lines. A list of regular expressions to match. It exports the lines that are
#matching any regular expression from the list.
#include_lines: ['^ERR', '^WARN']
#Exclude files. A list of regular expressions to match. Filebeat drops the files that
#are matching any regular expression from the list. By default, no files are dropped.
#exclude_files: ['.gz$']
#Optional additional fields. These fields can be freely picked
#to add additional information to the crawled log files for filtering
#fields:
#level: debug
#review: 1
#Multiline can be used for log messages spanning multiple lines. This is common
#for Java Stack Traces or C-Line Continuation
#The regexp Pattern that has to be matched. The example pattern matches all lines starting with [
#multiline.pattern: ^[
#Defines if the pattern set under pattern should be negated or not. Default is false.
#multiline.negate: false
#Match can be set to "after" or "before". It is used to define if lines should be append to a pattern
#that was (not) matched before or after or as long as a pattern is not matched based on negate.
#Note: After is the equivalent to previous and before is the equivalent to to next in Logstash
#multiline.match: after
#============================= Filebeat modules ===============================
filebeat.config.modules:
#Glob pattern for configuration loading
path: ${path.config}/modules.d/*.yml
#Set to true to enable config reloading
reload.enabled: false
#Period on which files under path should be checked for changes
#reload.period: 10s
#==================== Elasticsearch template setting ==========================
setup.template.settings:
index.number_of_shards: 3
#index.codec: best_compression
#_source.enabled: false
#================================ General =====================================
#The name of the shipper that publishes the network data. It can be used to group
#all the transactions sent by a single shipper in the web interface.
#name:
#The tags of the shipper are included in their own field with each
#transaction published.
#tags: ["service-X", "web-tier"]
#Optional fields that you can specify to add additional information to the
#output.
#fields:
#env: staging
#============================== Dashboards =====================================
#These settings control loading the sample dashboards to the Kibana index. Loading
#the dashboards is disabled by default and can be enabled either by setting the
#options here, or by using the -setup CLI flag or the setup command.
#setup.dashboards.enabled: false
#The URL from where to download the dashboards archive. By default this URL
#has a value which is computed based on the Beat name and version. For released
#versions, this URL points to the dashboard archive on the artifacts.elastic.co
#website.
#setup.dashboards.url:
#============================== Kibana =====================================
#Starting with Beats version 6.0.0, the dashboards are loaded via the Kibana API.
#This requires a Kibana endpoint configuration.
setup.kibana:
#Kibana Host
#Scheme and port can be left out and will be set to the default (http and 5601)
#In case you specify and additional path, the scheme is required: http://localhost:5601/path
#IPv6 addresses should always be defined as: https://[2001:db8::1]:5601
#host: "localhost:5601"
#Kibana Space ID
#ID of the Kibana Space into which the dashboards should be loaded. By default,
#the Default Space will be used.
#space.id:
#============================= Elastic Cloud ==================================
#These settings simplify using filebeat with the Elastic Cloud (https://cloud.elastic.co/).
#The cloud.id setting overwrites the output.elasticsearch.hosts and
#setup.kibana.host options.
#You can find the cloud.id in the Elastic Cloud web UI.
#cloud.id:
#The cloud.auth setting overwrites the output.elasticsearch.username and
#output.elasticsearch.password settings. The format is <user>:<pass>.
#cloud.auth:
#================================ Outputs =====================================
#Configure what output to use when sending the data collected by the beat.
#-------------------------- Elasticsearch output ------------------------------
output.elasticsearch:
#Array of hosts to connect to.
hosts: ["localhost:9200"]
#Optional protocol and basic auth credentials.
#protocol: "https"
#username: "elastic"
#password: "changeme"
#----------------------------- Logstash output --------------------------------
#output.logstash:
#The Logstash hosts
#hosts: ["localhost:5044"]
#Optional SSL. By default is off.
#List of root certificates for HTTPS server verifications
#ssl.certificate_authorities: ["/etc/pki/root/ca.pem"]
#Certificate for SSL client authentication
#ssl.certificate: "/etc/pki/client/cert.pem"
#Client Certificate Key
#ssl.key: "/etc/pki/client/cert.key"
#================================ Procesors =====================================
#Configure processors to enhance or manipulate events generated by the beat.
processors:
#================================ Logging =====================================
#Sets log level. The default log level is info.
#Available log levels are: error, warning, info, debug
#logging.level: debug
#At debug level, you can selectively enable logging only for some components.
#To enable all selectors use [""]. Examples of other selectors are "beat",
#"publish", "service".
#logging.selectors: [""]
#============================== Xpack Monitoring ===============================
#filebeat can export internal metrics to a central Elasticsearch monitoring
#cluster. This requires xpack monitoring to be enabled in Elasticsearch. The
#reporting is disabled by default.
#Set to true to enable the monitoring reporter.
#xpack.monitoring.enabled: false
#Uncomment to send the metrics to Elasticsearch. Most settings from the
#Elasticsearch output are accepted here as well. Any setting that is not set is
#automatically inherited from the Elasticsearch output configuration, so if you
#have the Elasticsearch output configured, you can simply uncomment the
#following line.
#xpack.monitoring.elasticsearch:
配置文件解释详细见:https://www.cnblogs.com/zlslch/p/6622079.html
第四步:filebeat抓取各个服务日志并以服务的名字创建索引存储到es当中
filebeat.config:
  prospectors:
    path: /data/software/filebeat-6.5.1/conf/*.yml
    reload.enabled: true
    reload.period: 10s
output.elasticsearch:
  hosts: ["IP:9200"]
  index: "%{[fields][out_topic]}"
setup.template.name: "customname"
setup.template.pattern: "customname-*"
setup.template.overwrite: true
logging:
level: debug- type: log
paths:
- /var/log/zookeeper/zookeeper.log
tags: ["zookeeper"]
exclude_files: [".gz$"]
scan_frequency: 1s
fields:
server_name: 主机名
out_topic: "zookeeper_log"
multiline:
pattern: "^\\S"
match: after
- type: log
paths:
- /var/log/nginx/access.log
tags: ["nginx"]
exclude_files: [".gz$"]
scan_frequency: 1s
fields:
server_name: 主机名
out_topic: "nginx_log"
multiline:
pattern: "^\\S"
match: after上边这块我们抓取了zookeeper日志和nginx日志,定义索引名称分别为zookeeper_log和nginx_log
第五步:启动filebeat并在es中查看生成的索引
./filebeat -e -c filebeat-123.yml
去es中查看索引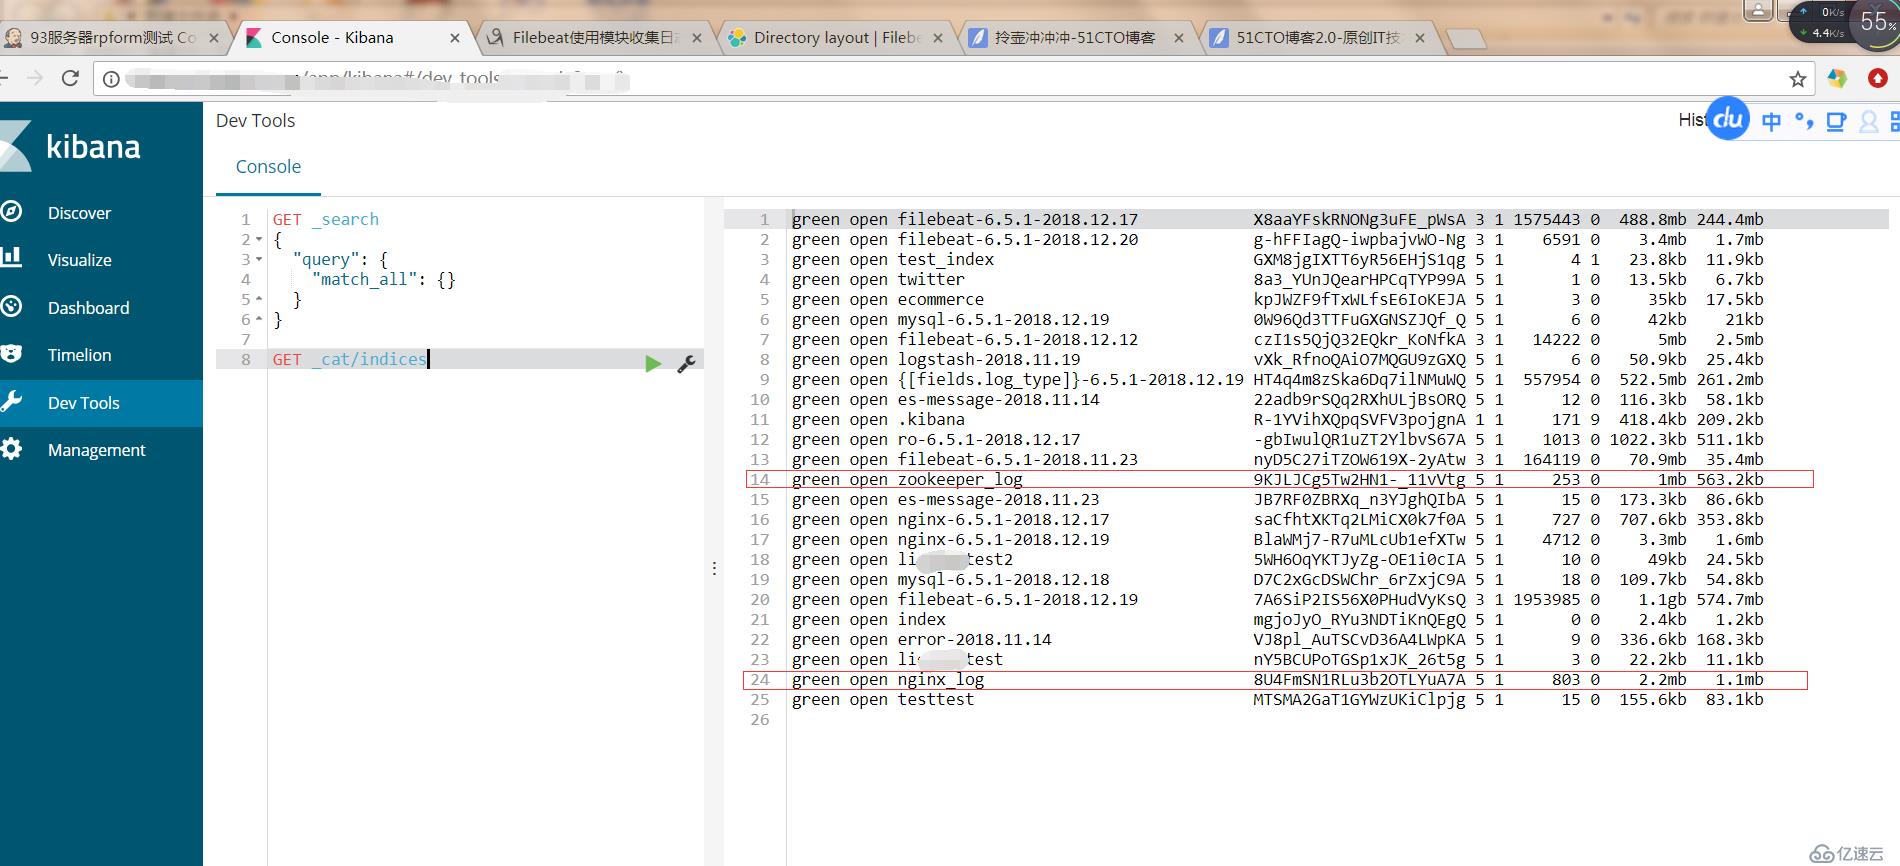
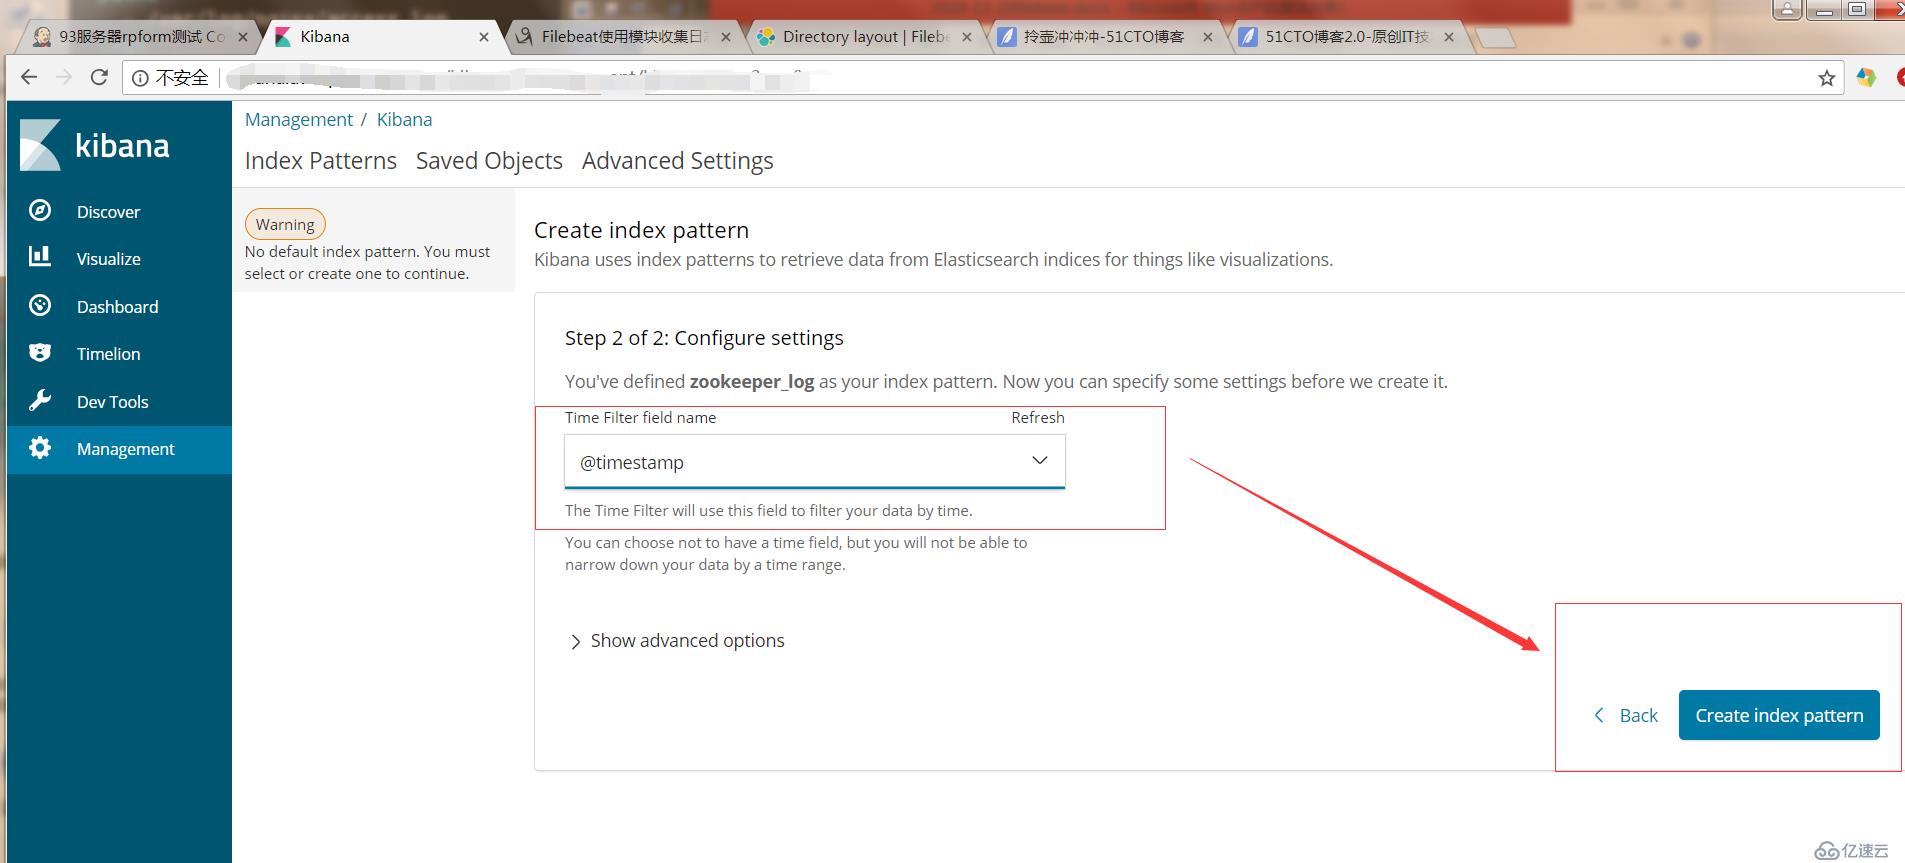
在es中已生成nginx_log和zookeeper_log索引,我们在kibana中去查看索引中的内容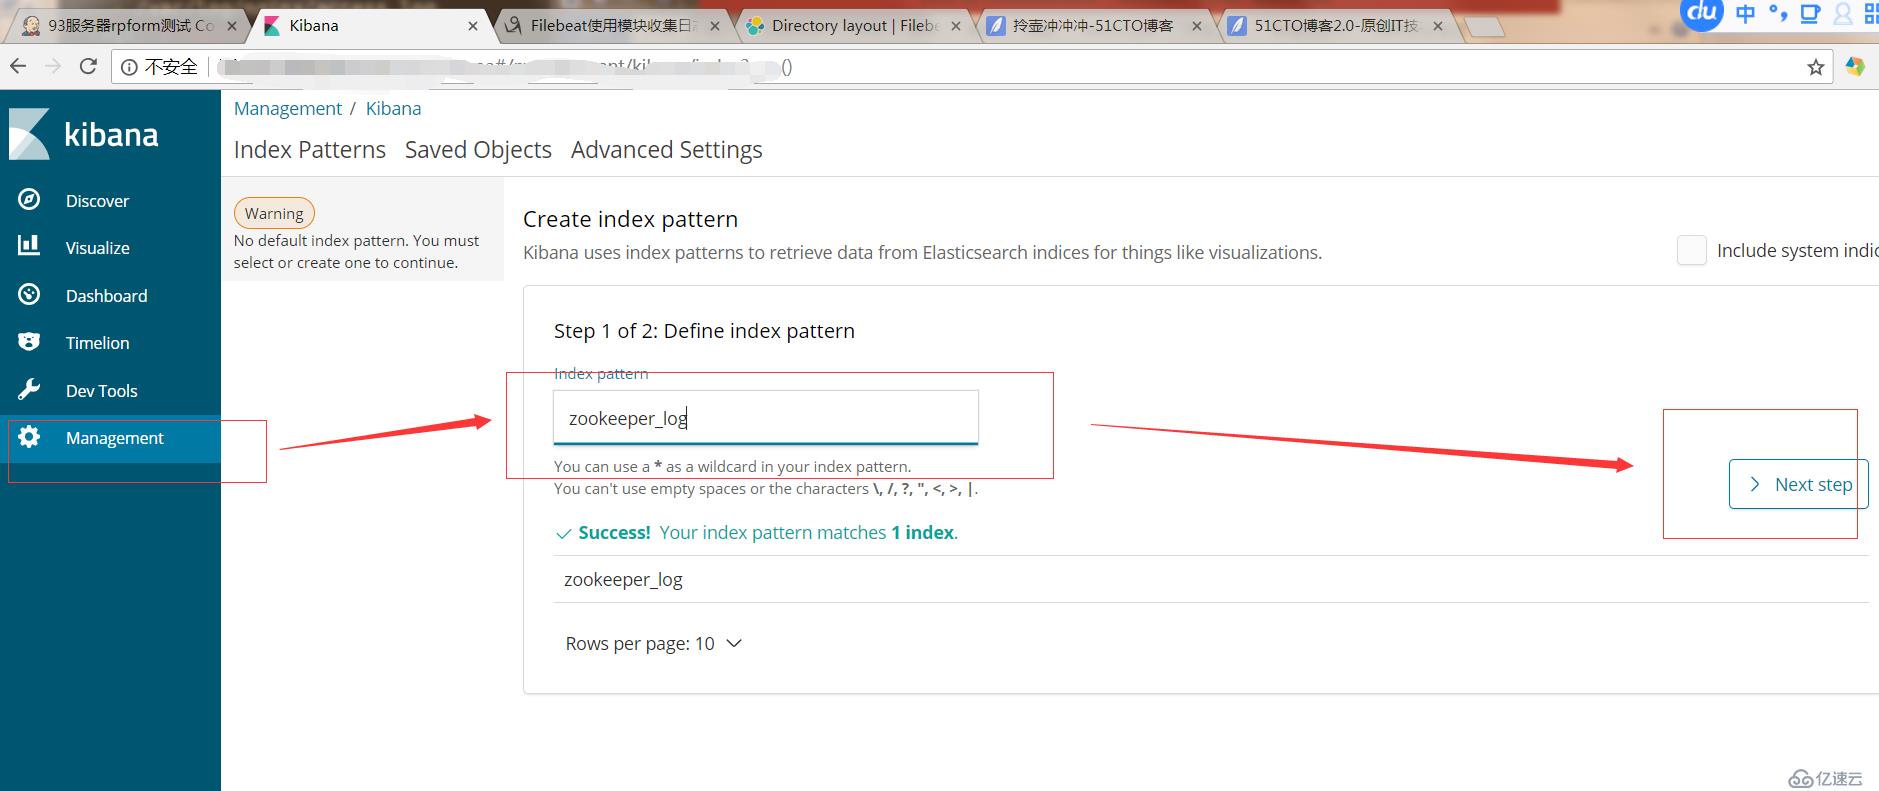
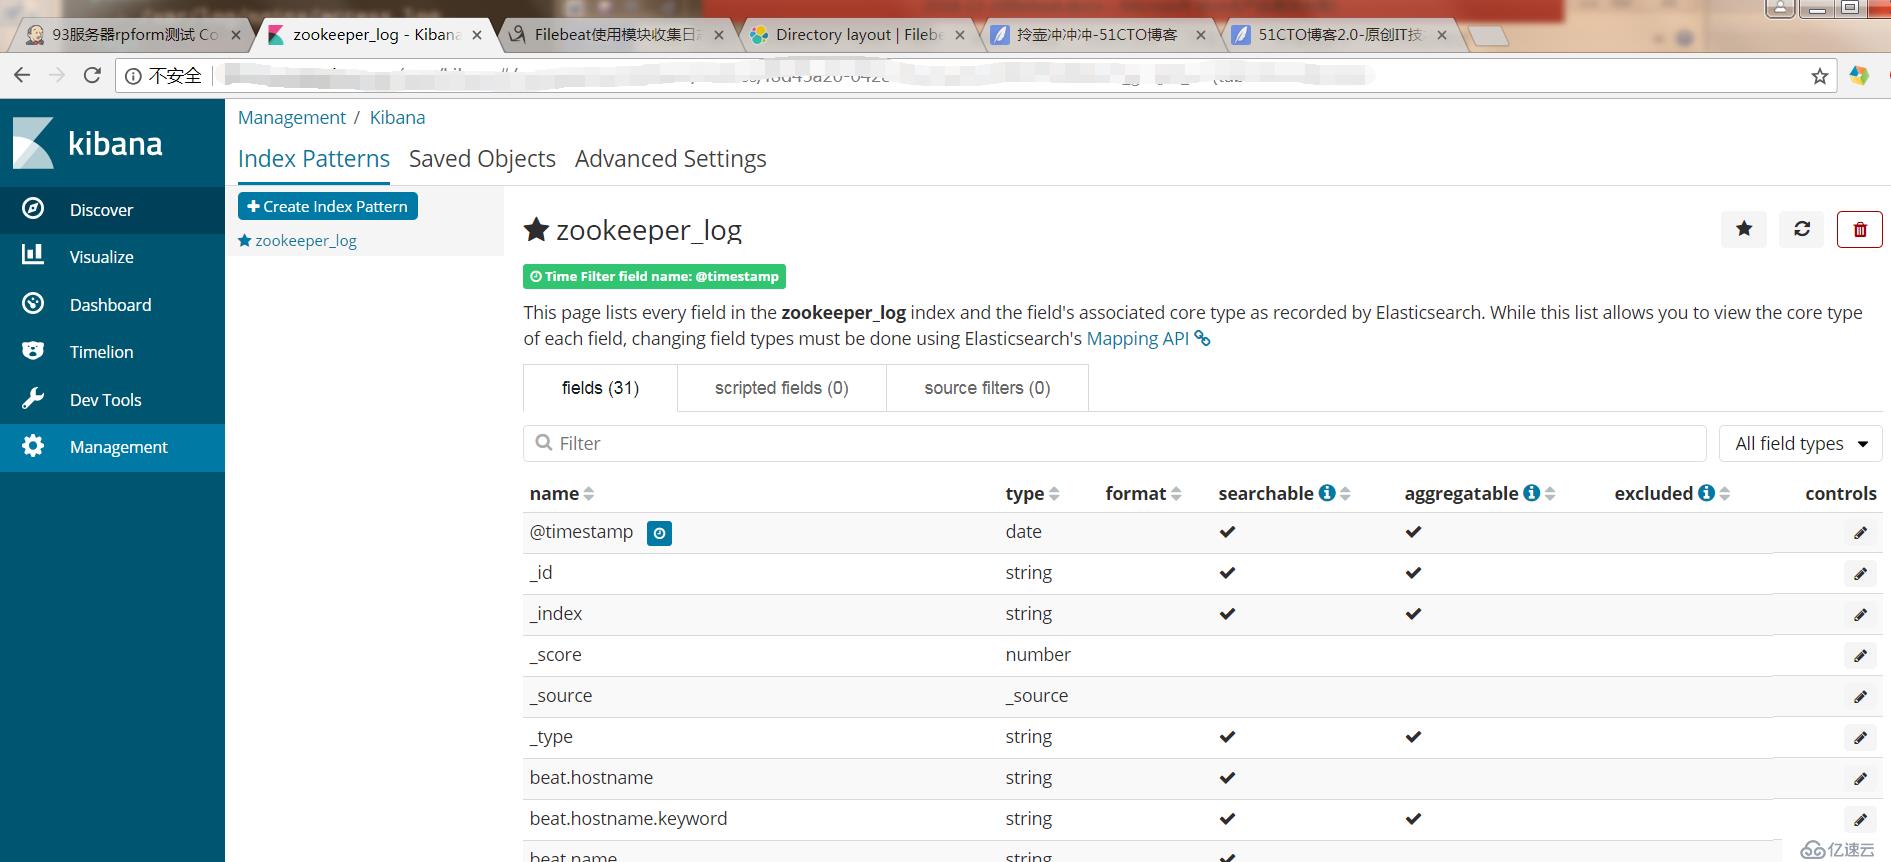
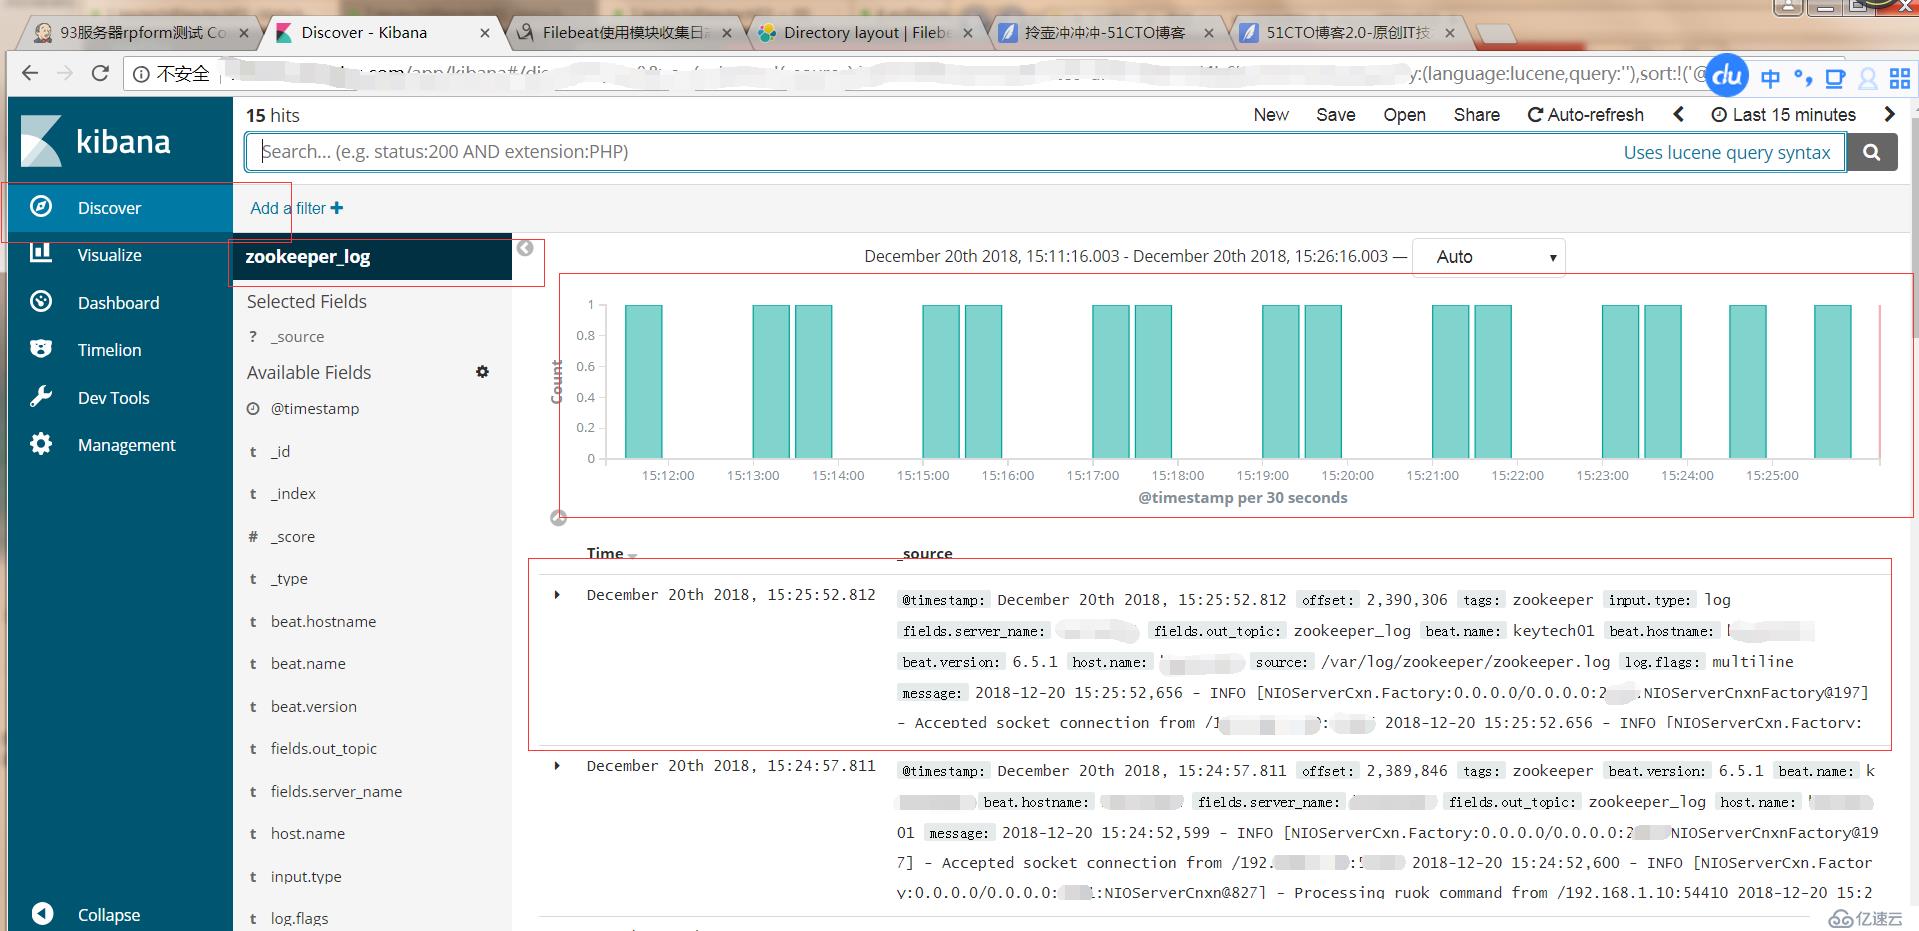
我看看到zookeeper_log索引里边已经有实时日志在跑,那么怎么自动让他更新呢。
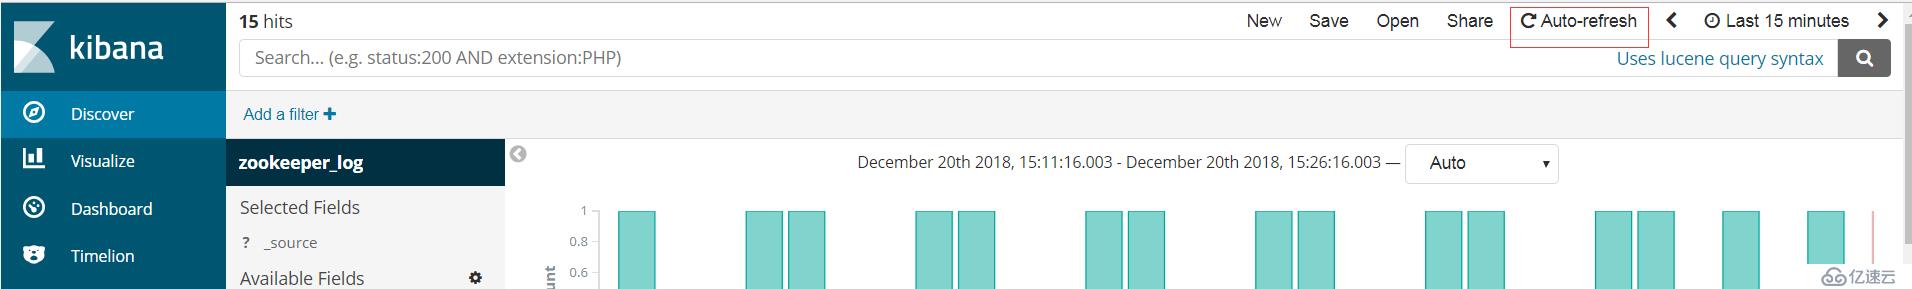
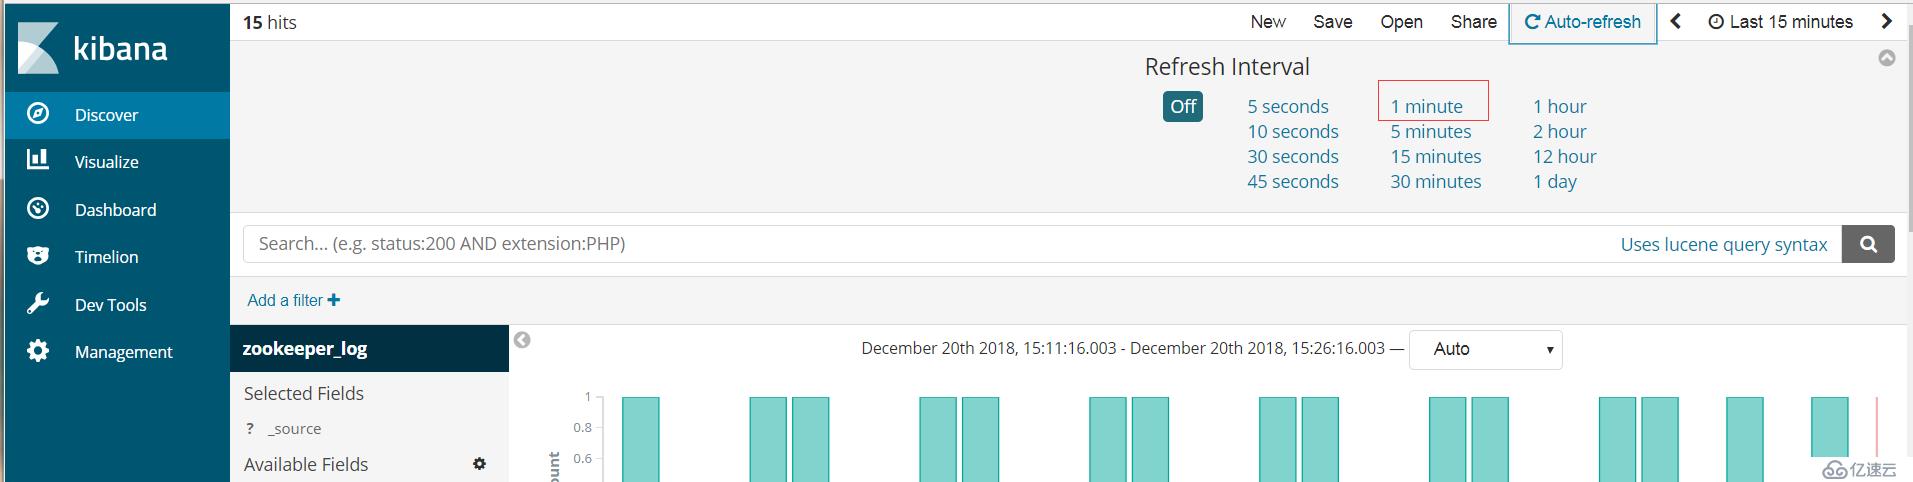
然后我们在kibana上就可以看到1分钟后日志在实时更新。
免责声明:本站发布的内容(图片、视频和文字)以原创、转载和分享为主,文章观点不代表本网站立场,如果涉及侵权请联系站长邮箱:is@yisu.com进行举报,并提供相关证据,一经查实,将立刻删除涉嫌侵权内容。


