本篇文章为大家展示了如何用gggenes 画基因结构图,内容简明扼要并且容易理解,绝对能使你眼前一亮,通过这篇文章的详细介绍希望你能有所收获。
install.packages("gggenes")
或者从github下载安装:
devtools::install_github("wilkox/gggenes")
2. 准备输入数据
官方给的例子如下:
> head(example_genes) molecule gene start end strand direction1 Genome5 genA 405113 407035 forward 12 Genome5 genB 407035 407916 forward 13 Genome5 genC 407927 408394 forward 14 Genome5 genD 408387 408737 reverse -15 Genome5 genE 408751 409830 forward 16 Genome5 genF 409836 410315 forward 1
输入数据应该包含6列,分别代表:
物种名 基因名 起始位置 结束位置 基因方向 基因方向
如果不需要考虑画出基因方向的话,只需要前4列数据就行:物种名,基因名,起始位置,结束位置
如果加上基因方向,就需要加上 strand 这一列,正负链分用“forward”和“reverse”表示。示例数据中的 direction 这一列是多余的,并不会被用到。
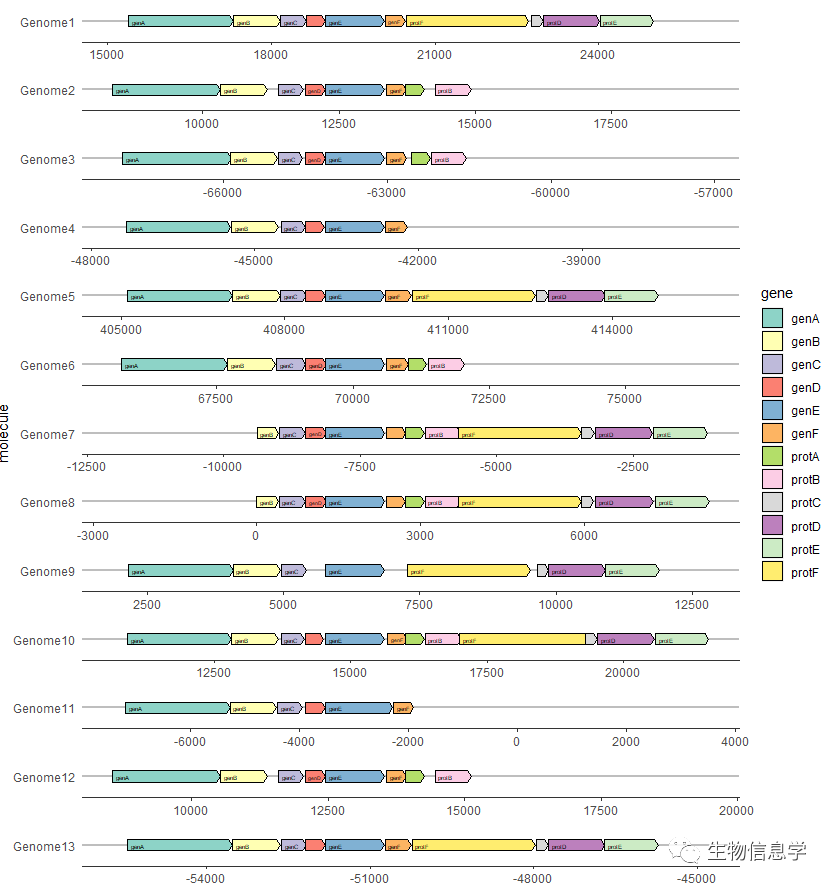
2. 作图
library(ggplot2)library(gggenes)ggplot(example_genes, aes(xmin = start, xmax = end,y = molecule, fill = gene)) +geom_gene_arrow() +facet_wrap(~ molecule, scales = "free", ncol = 1) +scale_fill_brewer(palette = "Set3") +theme_genes()
图如下:
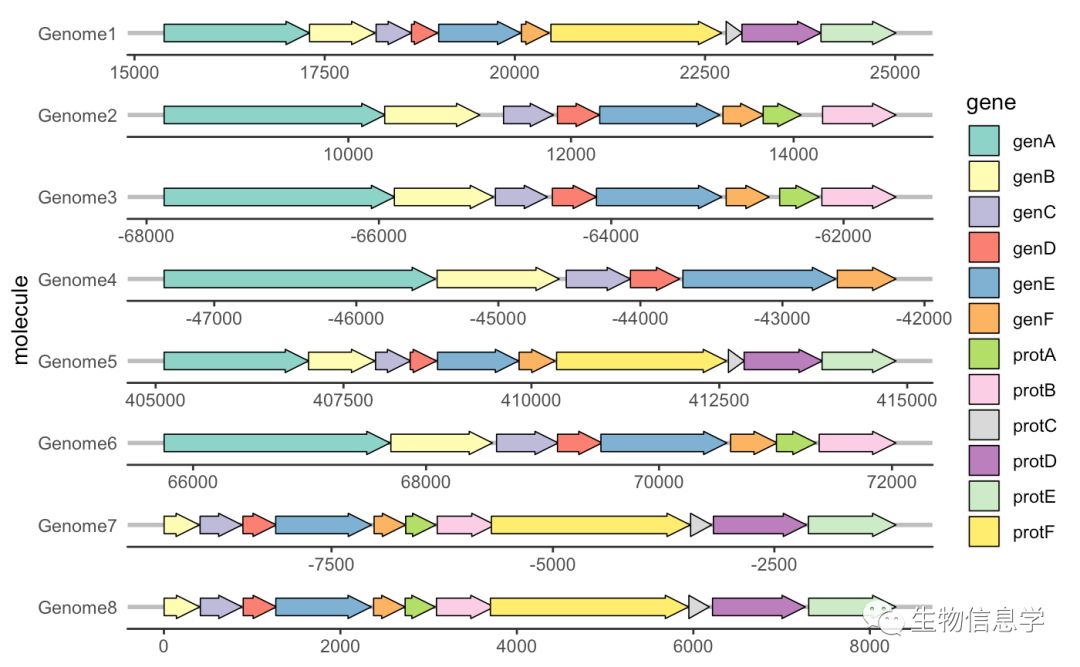
可以看出来,使用的是我们熟悉的ggplot2语法,再加上 geom_gene_arrow() 函数来实现了基因结构的作图。
下面的我们加上方向,也加上基因名称,代码如下:
ggplot(example_genes, aes(xmin = start, xmax = end, y = molecule, fill = gene, label = gene, forward = direction)) + geom_gene_arrow() + facet_wrap(~ molecule, scales = "free", ncol = 1) + scale_fill_brewer(palette = "Set3") + theme_genes() + geom_gene_label(align = "left")
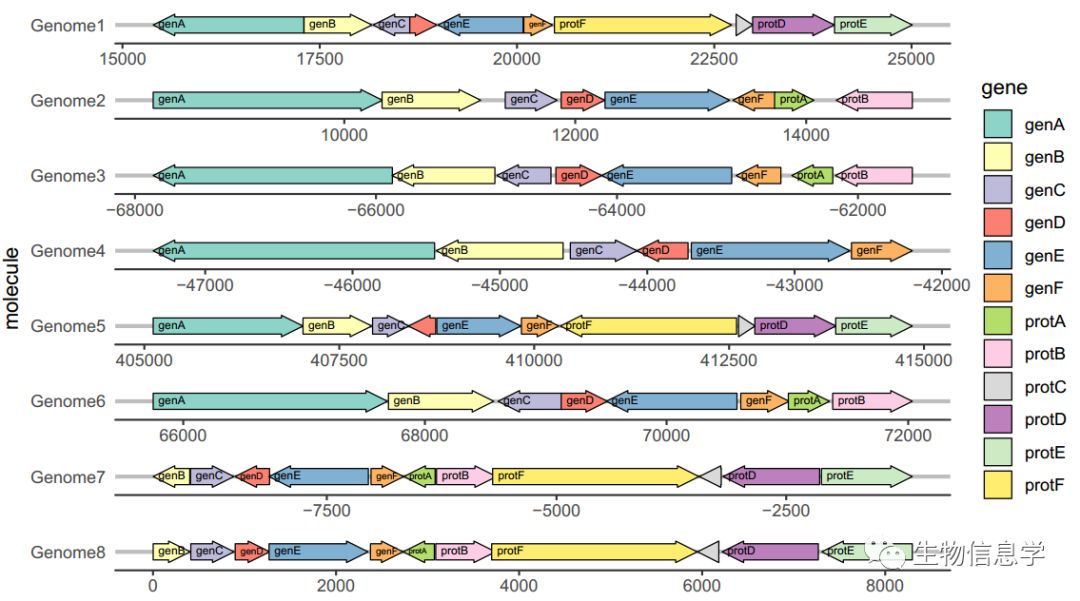
label = gene, forward = direction 指定了基因名和基因方向
geom_gene_label(align = "left") 在图上添加了基因名并靠左对齐
3. 其他用法
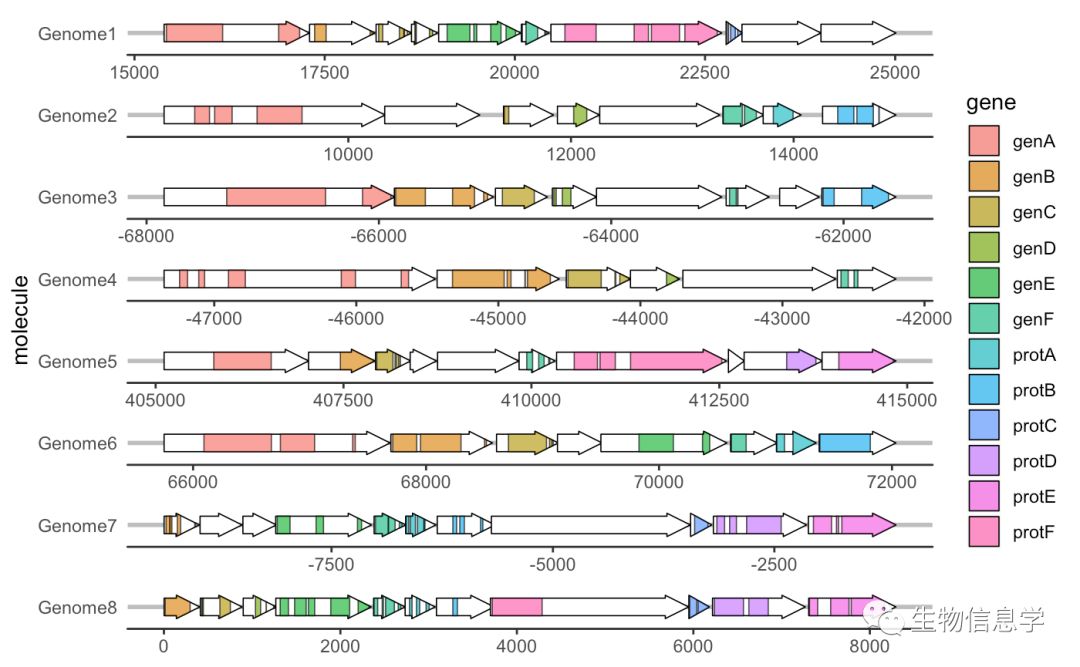
gggenes也可以如上图所示展现基因结构域特征或者比对信息,可以使用geom_subgene_arrow() 函数来实现,需要额外用到另一份数据example_subgenes,代码如下:
> head(example_subgenes) molecule gene start end strand subgene from to1 Genome5 genA 405113 407035 forward genA-1 405774 4065382 Genome5 genB 407035 407916 forward genB-1 407458 4078973 Genome5 genC 407927 408394 forward genC-1 407942 4081584 Genome5 genC 407927 408394 forward genC-2 408186 4082095 Genome5 genC 407927 408394 forward genC-3 408233 408257
ggplot(example_genes, aes(xmin = start, xmax = end, y = molecule)) + facet_wrap(~ molecule, scales = "free", ncol = 1) + geom_gene_arrow(fill = "white") + geom_subgene_arrow(data = example_subgenes, aes(xmin = start, xmax = end, y = molecule, fill = gene, xsubmin = from, xsubmax = to), color="black", alpha=.7) + theme_genes()
上述内容就是如何用gggenes 画基因结构图,你们学到知识或技能了吗?如果还想学到更多技能或者丰富自己的知识储备,欢迎关注亿速云行业资讯频道。
免责声明:本站发布的内容(图片、视频和文字)以原创、转载和分享为主,文章观点不代表本网站立场,如果涉及侵权请联系站长邮箱:is@yisu.com进行举报,并提供相关证据,一经查实,将立刻删除涉嫌侵权内容。


