这篇文章主要讲解了“Java线程堆栈信息分析”,文中的讲解内容简单清晰,易于学习与理解,下面请大家跟着小编的思路慢慢深入,一起来研究和学习“Java线程堆栈信息分析”吧!
当CPU飙升的时候,我们需要知道CPU此时在干嘛,具体什么进程、什么线程让CPU飙升
线程是操作系统能够进行运算调度的最小单位,跟踪占用CPU高的线程 可以了解线程的运行情况,定位可能或者问题代码
The first line of each thread represents the thread summary, which contains the following items:
| SECTION | EXAMPLE | DESCRIPTION |
|---|---|---|
| Name | "Reference Handler" | Human-readable name of the thread. This name can be set by calling the setNamemethod on a Threadobject and be obtained by calling getName on the object. |
| ID | #2 | A unique ID associated with each Thread object. This number is generated, starting at 1, for all threads in the system. Each time a Thread object is created, the sequence number is incremented and then assigned to the newly created Thread. This ID is read-only and can be obtained by calling getId on a Thread object. |
| Daemon status | daemon | A tag denoting if the thread is a daemon thread. If the thread is a daemon, this tag will be present; if the thread is a non-daemon thread, no tag will be present. For example, Thread-0 is not a daemon thread and therefore has no associated daemon tag in its summary: Thread-0" #12 prio=5.... |
| Priority | prio=10 | The numeric priority of the Java thread. Note that this does not necessarily correspond to the priority of the OS thread to with the Java thread is dispatched. The priority of a Thread object can be set using the setPriority method and obtained using the getPriority method. |
| OS Thread Priority | os_prio=2 | The OS thread priority. This priority can differ from the Java thread priority and corresponds to the OS thread on which the Java thread is dispatched. |
| Address | tid=0x00000250e4979000 | The address of the Java thread. This address represents the pointer address of the Java Native Interface (JNI) native Thread object (the C++ Thread object that backs the Java thread through the JNI). This value is obtained by converting the pointer to this (of the C++ object that backs the Java Thread object) to an integer on line 879 of hotspot/share/runtime/thread.cpp: st->print("tid=" INTPTR_FORMAT " ", p2i(this));Although the key for this item (tid) may appear to be the thread ID, it is actually the address of the underlying JNI C++ Thread object and thus is not the ID returned when calling getId on a Java Thread object. |
| OS Thread ID | nid=0x3c28 | The unique ID of the OS thread to which the Java Thread is mapped. This value is printed on line 42 of hotspot/share/runtime/osThread.cpp: st->print("nid=0x%x ", thread_id()); |
| Status | waiting on condition | A human-readable string depicting the current status of the thread. This string provides supplementary information beyond the basic thread state (see below) and can be useful in discovering the intended actions of a thread (i.e. was the thread trying to acquire a lock or waiting on a condition when it blocked). |
| Last Known Java Stack Pointer | [0x000000b82a9ff000] | The last known Stack Pointer (SP) for the stack associated with the thread. This value is supplied using native C++ code and is interlaced with the Java Thread class using the JNI. This value is obtained using the last_Java_sp() native method and is formatted into the thread dump on line 2886 of hotspot/share/runtime/thread.cpp: st->print_cr("[" INTPTR_FORMAT "]", (intptr_t)last_Java_sp() & ~right_n_bits(12));For simple thread dumps, this information may not be useful, but for more complex diagnostics, this SP value can be used to trace lock acquisition through a program. |
The second line represents the current state of the thread. The possible states for a thread are captured in the Thread.State enumeration:
NEW
RUNNABLE
BLOCKED
WAITING
TIMED_WAITING
TERMINATED
以上内容来源:https://dzone.com/articles/how-to-read-a-thread-dump
定位高cpu进程、线程参考上文 Java运行状态分析2:线程状态及堆栈信息
ps -mp {pid} -o THREAD,tid,time|sort -k 3 -nroot 0.4 19 - futex_ - - 8063 00:12:37 root 0.4 19 - futex_ - - 8072 00:11:25 root 0.4 19 - futex_ - - 8074 00:11:28 root 0.4 19 - futex_ - - 8083 00:11:50 root 0.4 19 - futex_ - - 8086 00:10:44 root 0.4 19 - futex_ - - 8087 00:10:38 root 0.4 19 - futex_ - - 8091 00:11:04 root 0.4 19 - futex_ - - 8093 00:11:35 root 0.4 19 - futex_ - - 8094 00:11:57 root 0.4 19 - futex_ - - 8095 00:11:01 root 0.4 19 - futex_ - - 8096 00:10:17 root 0.4 19 - futex_ - - 8099 00:12:08 root 0.4 19 - futex_ - - 8100 00:12:11 root 0.4 19 - futex_ - - 8101 00:12:26 root 0.5 19 - ep_pol - - 7071 00:12:42 root 0.5 19 - ep_pol - - 7073 00:12:53 root 0.5 19 - ep_pol - - 7078 00:14:19 root 0.5 19 - futex_ - - 8000 00:12:42 root 0.5 19 - futex_ - - 8021 00:13:38 root 0.5 19 - futex_ - - 8032 00:14:43 root 0.5 19 - futex_ - - 8098 00:13:17 root 0.5 19 - futex_ - - 8103 00:12:54 root 0.8 19 - ep_pol - - 7069 00:22:14 root 0.9 19 - ep_pol - - 7149 00:24:44 root 1.3 19 - futex_ - - 7100 00:35:06 root 2.2 19 - futex_ - - 20595 00:01:03
找到占用CPU高的线程id( 线程多,正序sort方便查占用CPU最大的线程)
将tid转16进制
printf %x {tid}printf %x 18849 49a1
查对应高load线程堆栈信息
jstack {进程id}|grep -A 30 {线程id}"AsyncAppender-Worker-ASYNC-IS-FILE" #9635 daemon prio=5 os_prio=0 tid=0x00007fcee0f55800 nid=0x36c9 waiting on condition [0x00007fd09f9fc000] java.lang.Thread.State: WAITING (parking) at sun.misc.Unsafe.park(Native Method) - parking to wait for <0x0000000576dd0688> (a java.util.concurrent.locks.AbstractQueuedSynchronizer$ConditionObject) at java.util.concurrent.locks.LockSupport.park(LockSupport.java:175) at java.util.concurrent.locks.AbstractQueuedSynchronizer$ConditionObject.await(AbstractQueuedSynchronizer.java:2039) at java.util.concurrent.ArrayBlockingQueue.take(ArrayBlockingQueue.java:403) at ch.qos.logback.core.AsyncAppenderBase$Worker.run(AsyncAppenderBase.java:264)
看了下 是logback日志打印占用,跟踪了下日志打印,这块日志打印的量相对较多,正常稳定高峰期间每秒大概产生10000条日志(7个节点),是其他服务的4倍左右
"RxIoScheduler-172" #9646 daemon prio=5 os_prio=0 tid=0x00007fcd98b5c000 nid=0x36dc waiting on condition [0x00007fcd2fe93000]
   java.lang.Thread.State: WAITING (parking)
  at sun.misc.Unsafe.park(Native Method)
  - parking to wait for  <0x0000000588b75208> (a java.util.concurrent.locks.AbstractQueuedSynchronizer$ConditionObject)
  at java.util.concurrent.locks.LockSupport.park(LockSupport.java:175)
  at java.util.concurrent.locks.AbstractQueuedSynchronizer$ConditionObject.await(AbstractQueuedSynchronizer.java:2039)
  at java.util.concurrent.ScheduledThreadPoolExecutor$DelayedWorkQueue.take(ScheduledThreadPoolExecutor.java:1081)
  at java.util.concurrent.ScheduledThreadPoolExecutor$DelayedWorkQueue.take(ScheduledThreadPoolExecutor.java:809)
  at java.util.concurrent.ThreadPoolExecutor.getTask(ThreadPoolExecutor.java:1067)
  at java.util.concurrent.ThreadPoolExecutor.runWorker(ThreadPoolExecutor.java:1127)
  at java.util.concurrent.ThreadPoolExecutor$Worker.run(ThreadPoolExecutor.java:617)
  at java.lang.Thread.run(Thread.java:745)
"RxIoScheduler-174" #9864 daemon prio=5 os_prio=0 tid=0x00007fcd99158000 nid=0x40a9 waiting on condition [0x00007fce0f1f0000]
   java.lang.Thread.State: WAITING (parking)
  at sun.misc.Unsafe.park(Native Method)
  - parking to wait for  <0x00000006cb53ddf0> (a java.util.concurrent.locks.AbstractQueuedSynchronizer$ConditionObject)
  at java.util.concurrent.locks.LockSupport.park(LockSupport.java:175)
  at java.util.concurrent.locks.AbstractQueuedSynchronizer$ConditionObject.await(AbstractQueuedSynchronizer.java:2039)
  at java.util.concurrent.ScheduledThreadPoolExecutor$DelayedWorkQueue.take(ScheduledThreadPoolExecutor.java:1081)
  at java.util.concurrent.ScheduledThreadPoolExecutor$DelayedWorkQueue.take(ScheduledThreadPoolExecutor.java:809)
  at java.util.concurrent.ThreadPoolExecutor.getTask(ThreadPoolExecutor.java:1067)
  at java.util.concurrent.ThreadPoolExecutor.runWorker(ThreadPoolExecutor.java:1127)
  at java.util.concurrent.ThreadPoolExecutor$Worker.run(ThreadPoolExecutor.java:617)
  at java.lang.Thread.run(Thread.java:745)
"hystrix-commonability-core-297" #9960 daemon prio=5 os_prio=0 tid=0x00007fd07c016000 nid=0x41f5 waiting on condition [0x00007fcd2a940000]
   java.lang.Thread.State: TIMED_WAITING (parking)
  at sun.misc.Unsafe.park(Native Method)
  - parking to wait for  <0x0000000243e8fff8> (a java.util.concurrent.SynchronousQueue$TransferStack)
  at java.util.concurrent.locks.LockSupport.parkNanos(LockSupport.java:215)
  at java.util.concurrent.SynchronousQueue$TransferStack.awaitFulfill(SynchronousQueue.java:460)
  at java.util.concurrent.SynchronousQueue$TransferStack.transfer(SynchronousQueue.java:362)
  at java.util.concurrent.SynchronousQueue.poll(SynchronousQueue.java:941)
  at java.util.concurrent.ThreadPoolExecutor.getTask(ThreadPoolExecutor.java:1066)
  at java.util.concurrent.ThreadPoolExecutor.runWorker(ThreadPoolExecutor.java:1127)
  at java.util.concurrent.ThreadPoolExecutor$Worker.run(ThreadPoolExecutor.java:617)
  at java.lang.Thread.run(Thread.java:745)
"RxIoScheduler-175" #10015 daemon prio=5 os_prio=0 tid=0x00007fcd991b5800 nid=0x45e8 waiting on condition [0x00007fcd55cdb000]
   java.lang.Thread.State: WAITING (parking)
  at sun.misc.Unsafe.park(Native Method)
  - parking to wait for  <0x0000000732e899a8> (a java.util.concurrent.locks.AbstractQueuedSynchronizer$ConditionObject)
  at java.util.concurrent.locks.LockSupport.park(LockSupport.java:175)
  at java.util.concurrent.locks.AbstractQueuedSynchronizer$ConditionObject.await(AbstractQueuedSynchronizer.java:2039)
  at java.util.concurrent.ScheduledThreadPoolExecutor$DelayedWorkQueue.take(ScheduledThreadPoolExecutor.java:1081)
  at java.util.concurrent.ScheduledThreadPoolExecutor$DelayedWorkQueue.take(ScheduledThreadPoolExecutor.java:809)
  at java.util.concurrent.ThreadPoolExecutor.getTask(ThreadPoolExecutor.java:1067)
  at java.util.concurrent.ThreadPoolExecutor.runWorker(ThreadPoolExecutor.java:1127)
  at java.util.concurrent.ThreadPoolExecutor$Worker.run(ThreadPoolExecutor.java:617)
  at java.lang.Thread.run(Thread.java:745)
"http-nio-18002-exec-123" #2505 daemon prio=5 os_prio=0 tid=0x00007fce90042800 nid=0xafa waiting on condition [0x00007fcd2932a000]
--
"RxComputationScheduler-13" #277 daemon prio=5 os_prio=0 tid=0x00007fcec4214000 nid=0x128 runnable [0x00007fce0d9d8000]
   java.lang.Thread.State: TIMED_WAITING (parking)
  at sun.misc.Unsafe.park(Native Method)
  - parking to wait for  <0x000000023c4df068> (a java.util.concurrent.locks.AbstractQueuedSynchronizer$ConditionObject)
  at java.util.concurrent.locks.LockSupport.parkNanos(LockSupport.java:215)
  at java.util.concurrent.locks.AbstractQueuedSynchronizer$ConditionObject.awaitNanos(AbstractQueuedSynchronizer.java:2078)
  at java.util.concurrent.ScheduledThreadPoolExecutor$DelayedWorkQueue.take(ScheduledThreadPoolExecutor.java:1093)
  at java.util.concurrent.ScheduledThreadPoolExecutor$DelayedWorkQueue.take(ScheduledThreadPoolExecutor.java:809)
  at java.util.concurrent.ThreadPoolExecutor.getTask(ThreadPoolExecutor.java:1067)
  at java.util.concurrent.ThreadPoolExecutor.runWorker(ThreadPoolExecutor.java:1127)
  at java.util.concurrent.ThreadPoolExecutor$Worker.run(ThreadPoolExecutor.java:617)
  at java.lang.Thread.run(Thread.java:745)
"RxComputationScheduler-30" #350 daemon prio=5 os_prio=0 tid=0x00007fcf34093000 nid=0x171 runnable [0x00007fcd54bcc000]
   java.lang.Thread.State: TIMED_WAITING (parking)
  at sun.misc.Unsafe.park(Native Method)
  - parking to wait for  <0x000000023cd13530> (a java.util.concurrent.locks.AbstractQueuedSynchronizer$ConditionObject)
  at java.util.concurrent.locks.LockSupport.parkNanos(LockSupport.java:215)
  at java.util.concurrent.locks.AbstractQueuedSynchronizer$ConditionObject.awaitNanos(AbstractQueuedSynchronizer.java:2078)
  at java.util.concurrent.ScheduledThreadPoolExecutor$DelayedWorkQueue.take(ScheduledThreadPoolExecutor.java:1093)
  at java.util.concurrent.ScheduledThreadPoolExecutor$DelayedWorkQueue.take(ScheduledThreadPoolExecutor.java:809)
  at java.util.concurrent.ThreadPoolExecutor.getTask(ThreadPoolExecutor.java:1067)
  at java.util.concurrent.ThreadPoolExecutor.runWorker(ThreadPoolExecutor.java:1127)
  at java.util.concurrent.ThreadPoolExecutor$Worker.run(ThreadPoolExecutor.java:617)
  at java.lang.Thread.run(Thread.java:745)
hystrix rxjava CPU较高,这块后续分析
推荐使用:
https://fastthread.io
可本地安装,区分收费免费,简单调试跟踪可以直接在线使用
上传dump文件,进入分析界面,界面比较直观的统计了线程情况,通过线程状态做了分组
线程概览
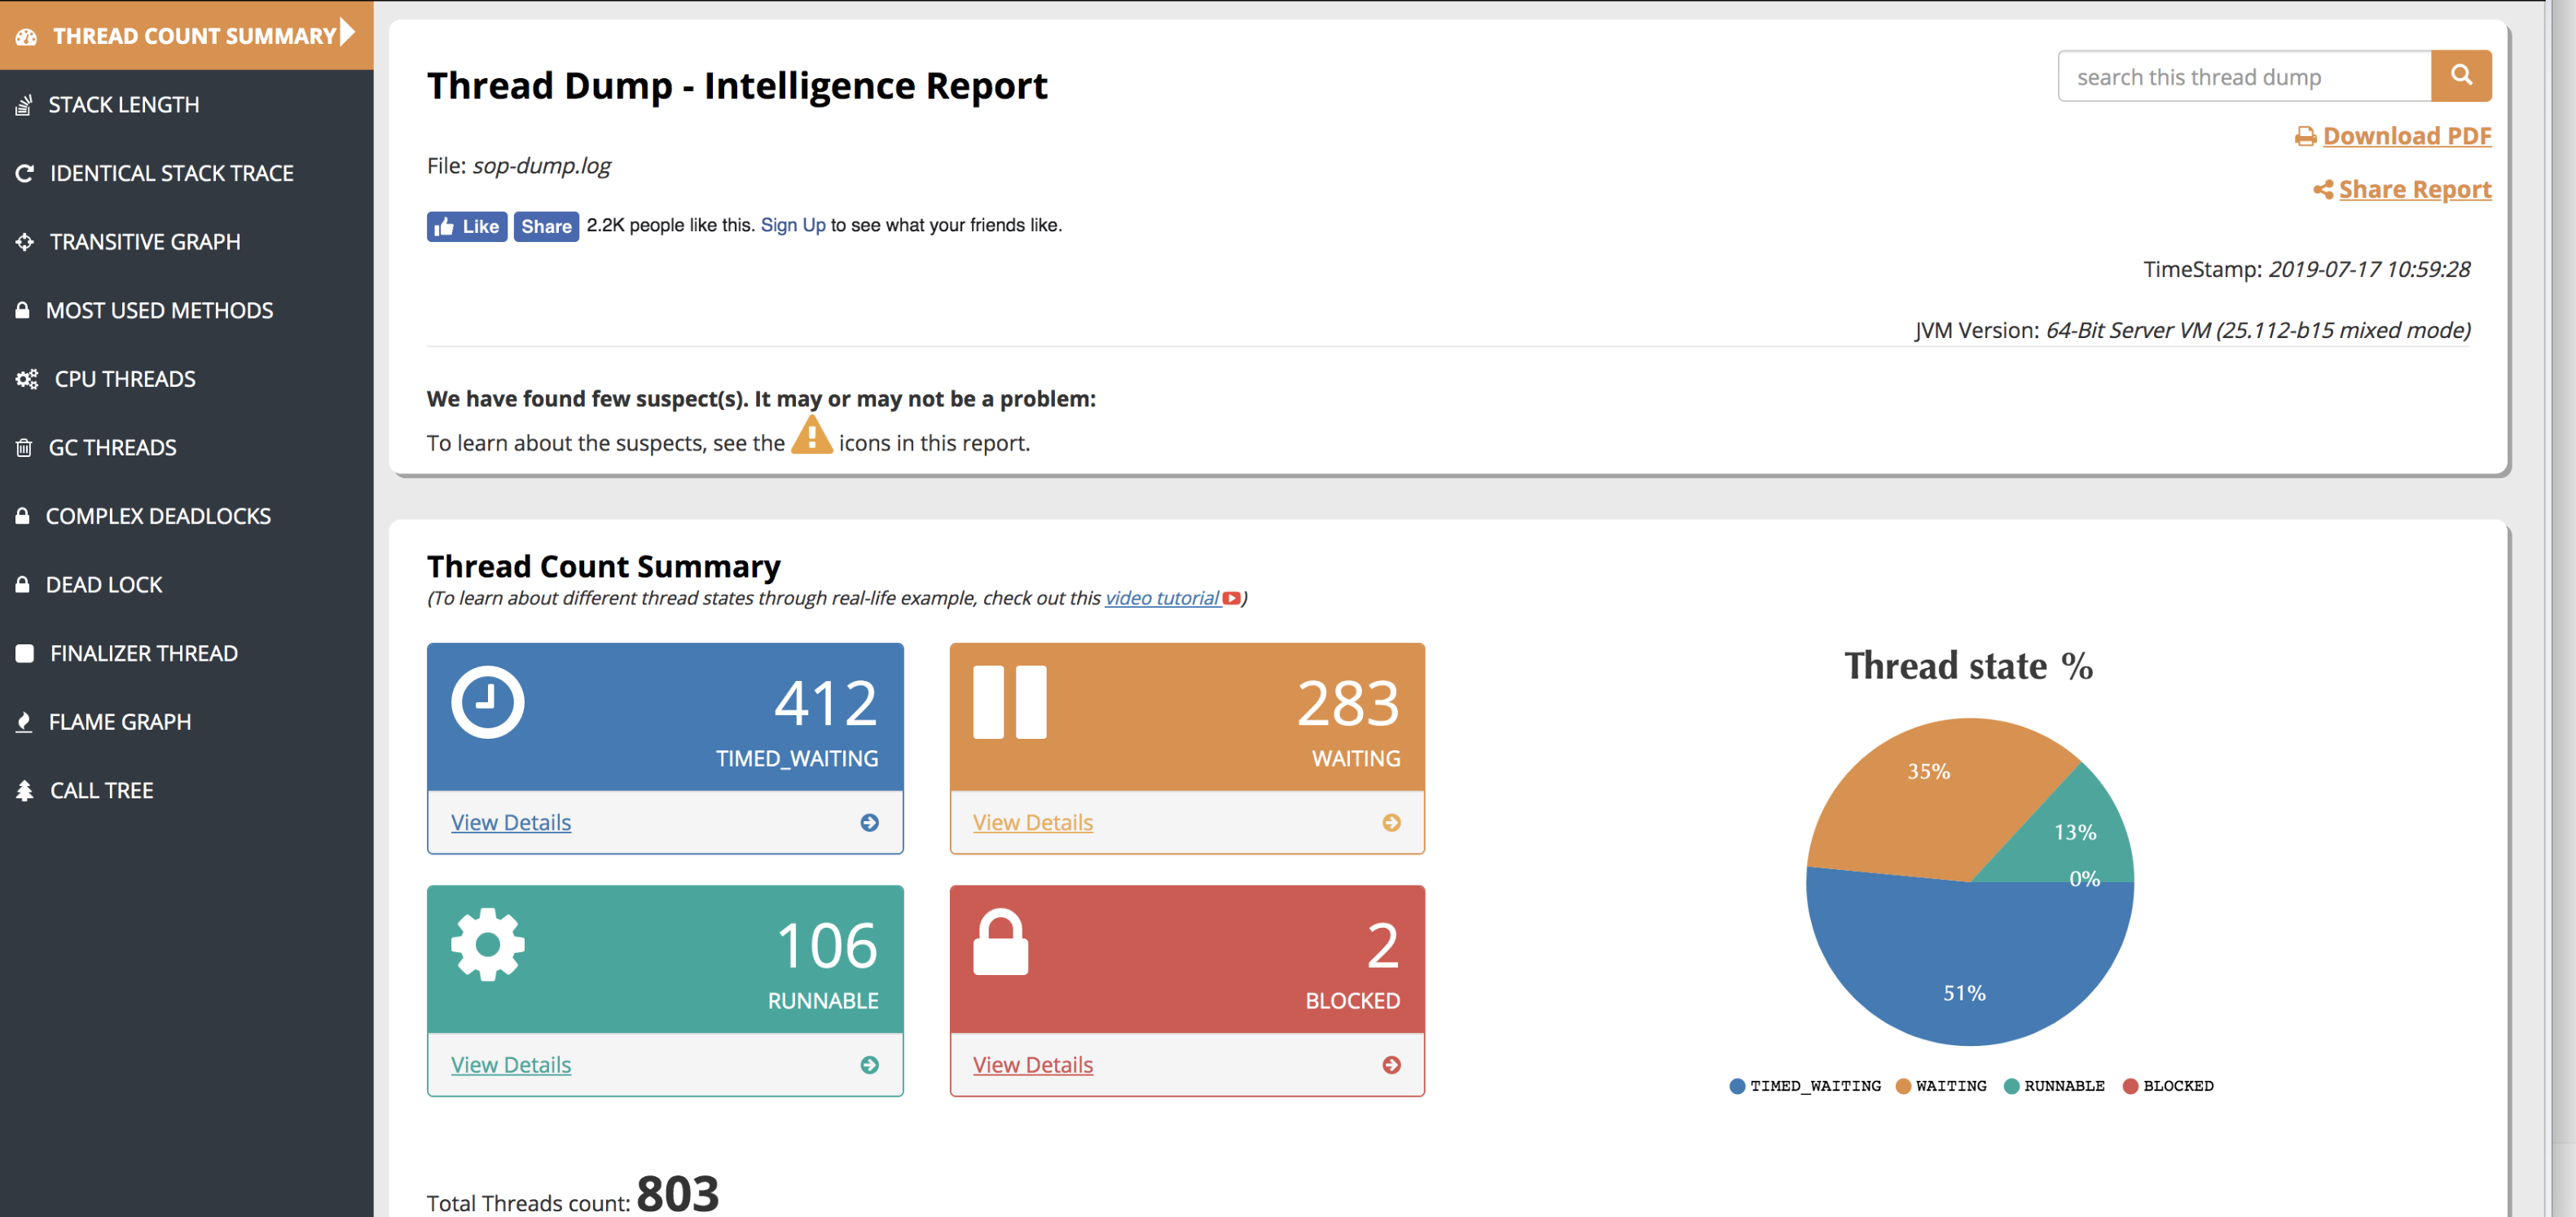
主要需要关心下线程的总数 是否符合我们的预期,blocked线程可能会导致死锁情况
目前我们系统线程数相对较多,200 Tomcat worker线程、+ 10个系统hystrix线程 + 异步任务线程 + 其他线程,这边800多个在预期内,一些等待线程也是正常状态
关于blocked线程,需要看下量是否多,是否是正常范围内的,同线程状态角度,涉及同步操作,是会产生blocked的,工程这边kafka在poll期间代码实现通过synchronized实现,这块是正常场景
waiting : nio Tomcat在压力小的时候,worker等待新请求到来
Timed_waiting: nio tomcat 压力大场景 worker通过线程池实现,请求进入队列,新请求场景会等待释放线程,同时处理默认200,出现这种场景,可以跟踪下当时的流量和rt情况,查看释放因为请求量和响应时间问题导致这块阻塞,主机性能好可以适当提升下并发处理量,并从接口性能层面跟踪排查
异步任务场景,进入条件等待也将产生timed_waiting
线程分组统计
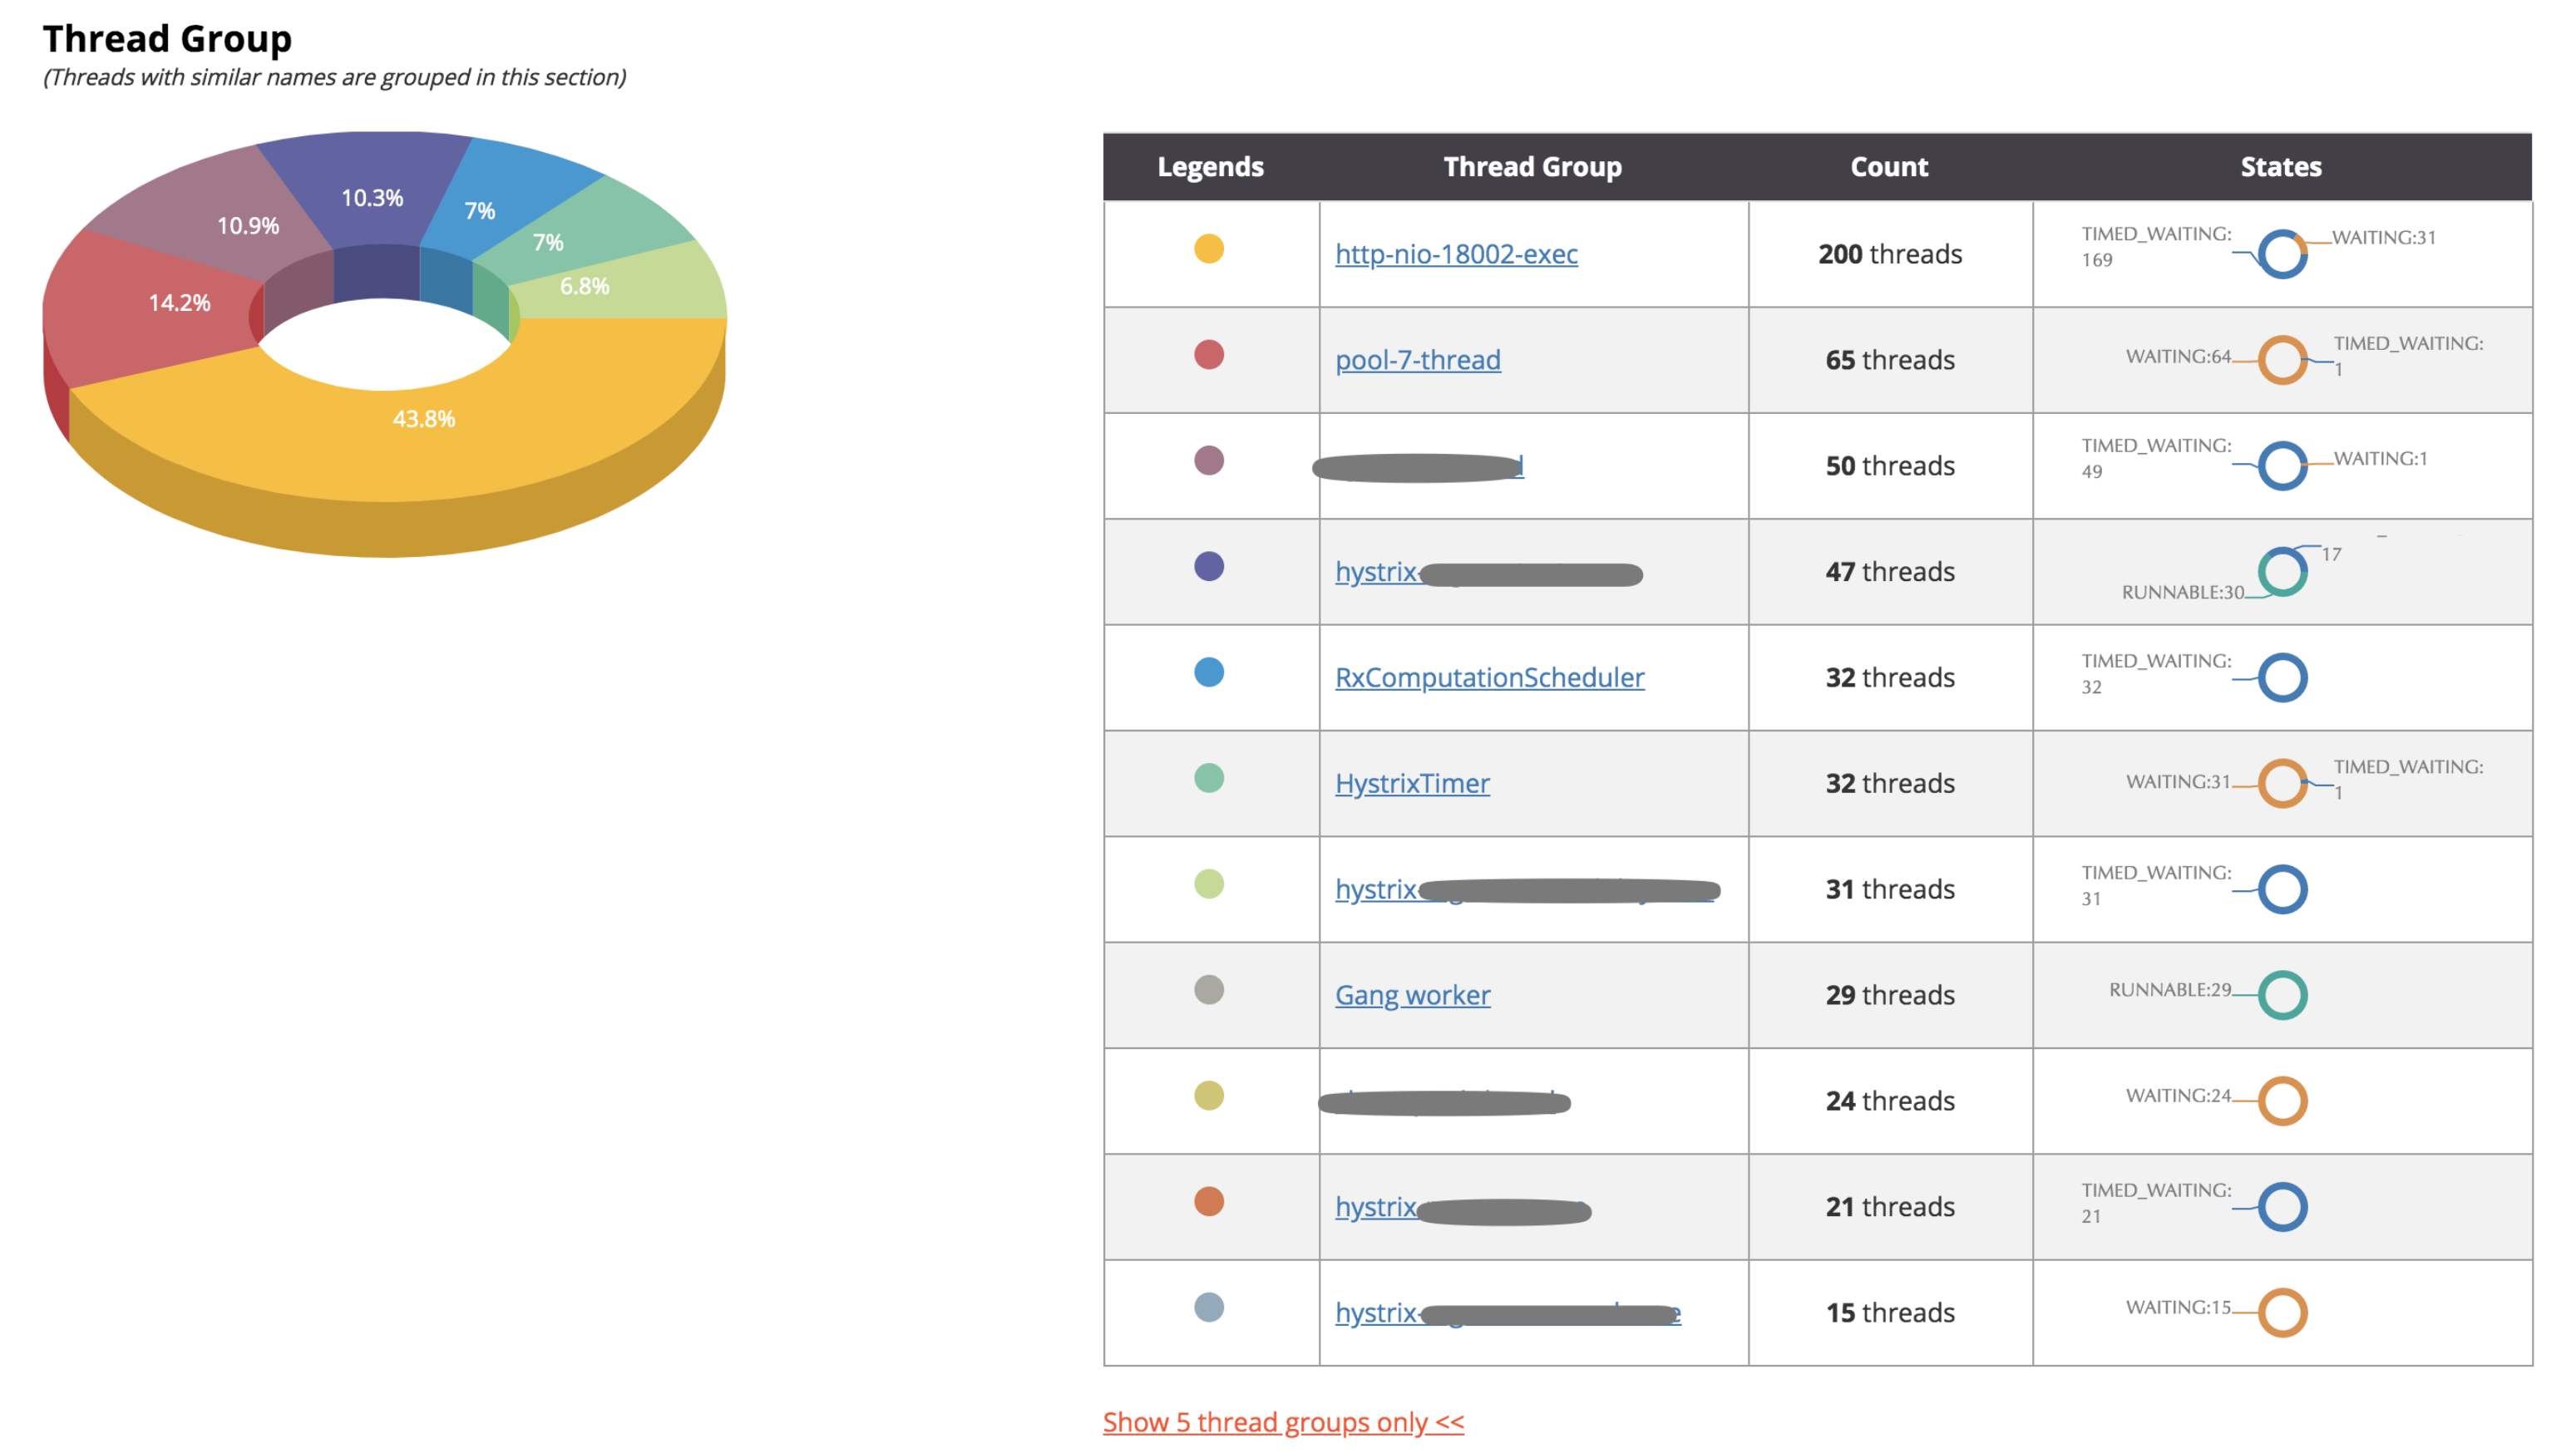
这块可以比较方便的看各个线程组的线程数量情况,通过这边看是否符合预期场景
线程数量原则上是尽可能的保持小,多线程可以更多的占用CPU,一定程度减少响应时间,但并非是提示系统性能的手段,过多的线程将代理CPU上下文切换时间,线程上下文拷贝也带来系统资源的开销
感谢各位的阅读,以上就是“Java线程堆栈信息分析”的内容了,经过本文的学习后,相信大家对Java线程堆栈信息分析这一问题有了更深刻的体会,具体使用情况还需要大家实践验证。这里是亿速云,小编将为大家推送更多相关知识点的文章,欢迎关注!
免责声明:本站发布的内容(图片、视频和文字)以原创、转载和分享为主,文章观点不代表本网站立场,如果涉及侵权请联系站长邮箱:is@yisu.com进行举报,并提供相关证据,一经查实,将立刻删除涉嫌侵权内容。


