本文实例为大家分享了python读取mysql数据绘制条形图的具体代码,供大家参考,具体内容如下
Mysql 脚本示例:
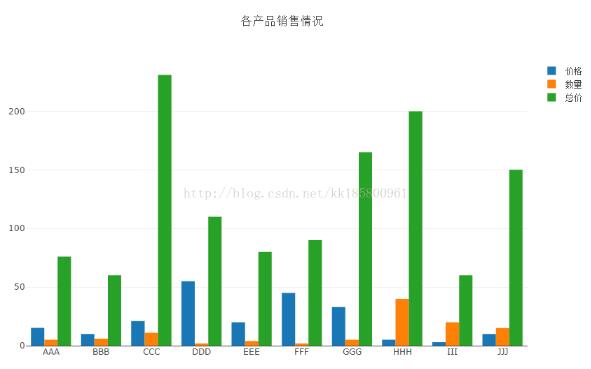
create table demo(
 id int
,product varchar(50)
,price decimal(18,2)
,quantity int
,amount decimal(18,2)
,orderdate datetime
);
insert into demo
select 1,'AAA',15.2,5,76,'2017-09-09' union all
select 2,'BBB',10,6,60,'2016-05-18' union all
select 3,'CCC',21,11,231,'2014-07-11' union all
select 4,'DDD',55,2,110,'2016-12-24' union all
select 5,'EEE',20,4,80,'2017-02-08' union all
select 6,'FFF',45,2,90,'2016-08-19' union all
select 7,'GGG',33,5,165,'2017-10-11' union all
select 8,'HHH',5,40,200,'2014-08-30' union all
select 9,'III',3,20,60,'2015-02-25' union all
select 10,'JJJ',10,15,150,'2015-11-02';
python 绘图分析:
# -*- coding: utf-8 -*-
#import numpy
import MySQLdb
import plotly.plotly
import plotly.graph_objs as pg

host = "localhost"
port = 3306
user = "root"
passwd = "mysql"
charset = "utf8"
dbname = "test"
conn = None

try:
  conn = MySQLdb.Connection(
    host = host,
    port = port,
    user = user,
    passwd = passwd,
    db = dbname,
    charset = charset
    )
  cur = conn.cursor(MySQLdb.cursors.DictCursor)
  cur.execute("select * from demo;")
  rows = cur.fetchall()
  #rows = numpy.array(rows)
  lists = [[],[],[],[]]
  for row in rows:
    lists[0].append(row["product"])
    lists[1].append(row["price"])
    lists[2].append(row["quantity"])
    lists[3].append(row["amount"])
  #print(lists)
  #print(lists[0])
  #print(([x[0] for x in lists]))

  date_price = pg.Bar( x=lists[0], y=lists[1], name='价格')
  date_quantity = pg.Bar( x=lists[0], y=lists[2], name='数量')
  date_amount = pg.Bar( x=lists[0], y=lists[3], name='总价')
  data = [date_price, date_quantity, date_amount]
  #barmode = [stack,group,overlay,relative]
  layout = pg.Layout( barmode='group',title="各产品销售情况" )
  fig = pg.Figure(data=data, layout=layout)
  plotly.offline.plot(fig, filename = "C:/Users/huangzecheng/Desktop/test.html")

finally:
  if conn:
    conn.close()
将代码保存为文件 bartest.py ,执行脚本 python bartest.py ,生成 html 文件如下:
以上就是本文的全部内容,希望对大家的学习有所帮助,也希望大家多多支持亿速云。
免责声明:本站发布的内容(图片、视频和文字)以原创、转载和分享为主,文章观点不代表本网站立场,如果涉及侵权请联系站长邮箱:is@yisu.com进行举报,并提供相关证据,一经查实,将立刻删除涉嫌侵权内容。


