小编给大家分享一下jQuery插件echarts如何设置折线图中折线线条颜色和折线点颜色,相信大部分人都还不怎么了解,因此分享这篇文章给大家参考一下,希望大家阅读完这篇文章后大有收获,下面让我们一起去了解一下吧!
1、问题背景
设计一条折线图,但是图形中不用插件自带的颜色,需要自定义线条和折点的颜色
2、实现源码
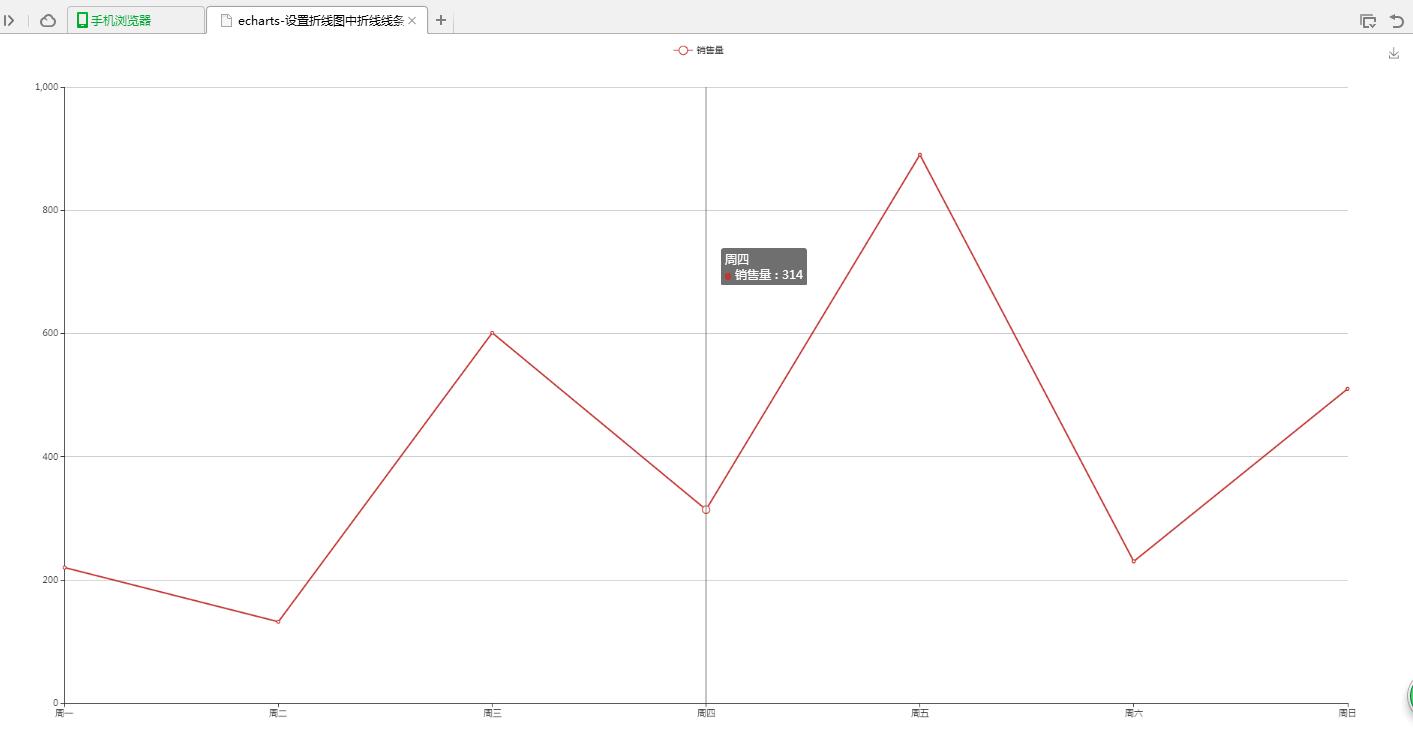
(1)图形自分配颜色
<!DOCTYPE html>
<html>
<head>
<meta charset="UTF-8">
<title>echarts-设置折线图中折线线条颜色和折线点颜色</title>
<link rel="shortcut icon" href="../js/echarts-2.2.7/doc/asset/ico/favicon.png" rel="external nofollow" rel="external nofollow" rel="external nofollow" >
<script type="text/javascript" src="../js/echarts-2.2.7/doc/asset/js/jquery.min.js" ></script>
<script type="text/javascript" src="../js/echarts-2.2.7/doc/example/www2/js/echarts-all.js" ></script>
<style>
body,html{
width: 99%;
height: 99%;
font-family: "微软雅黑";
font-size: 12px;
}
#line{
width: 100%;
height: 100%;
}
</style>
<script>
$(function(){
var chart = document.getElementById('line');
var echart = echarts.init(chart);
var option = {
title: {
text: ''
},
tooltip: {
trigger: 'axis'
},
legend: {
data:['销售量']
},
grid: {
left: '3%',
right: '4%',
bottom: '3%',
containLabel: true
},
toolbox: {
feature: {
saveAsImage: {}
}
},
xAxis: {
type: 'category',
boundaryGap: false,
data: ['周一','周二','周三','周四','周五','周六','周日']
},
yAxis: {
type: 'value'
},
series: [
{
name:'销售量',
type:'line',
stack: '销售量',
data:[220, 132, 601, 314, 890, 230, 510]
}
]
};
echart.setOption(option);
});
</script>
</head>
<body>
<div id="line"></div>
</body>
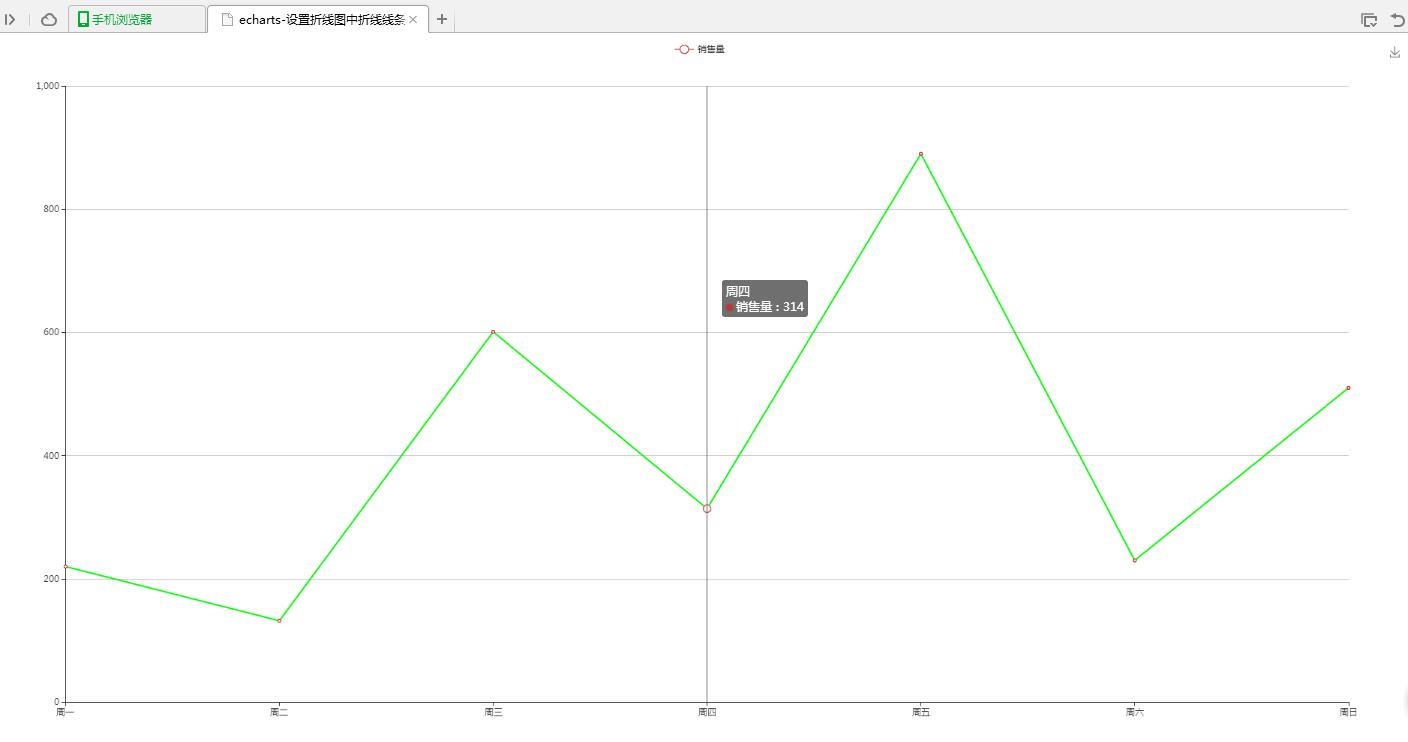
</html>(2)线条自定义颜色
<!DOCTYPE html>
<html>
<head>
<meta charset="UTF-8">
<title>echarts-设置折线图中折线线条颜色和折线点颜色</title>
<link rel="shortcut icon" href="../js/echarts-2.2.7/doc/asset/ico/favicon.png" rel="external nofollow" rel="external nofollow" rel="external nofollow" >
<script type="text/javascript" src="../js/echarts-2.2.7/doc/asset/js/jquery.min.js" ></script>
<script type="text/javascript" src="../js/echarts-2.2.7/doc/example/www2/js/echarts-all.js" ></script>
<style>
body,html{
width: 99%;
height: 99%;
font-family: "微软雅黑";
font-size: 12px;
}
#line{
width: 100%;
height: 100%;
}
</style>
<script>
$(function(){
var chart = document.getElementById('line');
var echart = echarts.init(chart);
var option = {
title: {
text: ''
},
tooltip: {
trigger: 'axis'
},
legend: {
data:['销售量']
},
grid: {
left: '3%',
right: '4%',
bottom: '3%',
containLabel: true
},
toolbox: {
feature: {
saveAsImage: {}
}
},
xAxis: {
type: 'category',
boundaryGap: false,
data: ['周一','周二','周三','周四','周五','周六','周日']
},
yAxis: {
type: 'value'
},
series: [
{
name:'销售量',
type:'line',
stack: '销售量',
itemStyle : {
normal : {
lineStyle:{
color:'#00FF00'
}
}
},
data:[220, 132, 601, 314, 890, 230, 510]
}
]
};
echart.setOption(option);
});
</script>
</head>
<body>
<div id="line"></div>
</body>
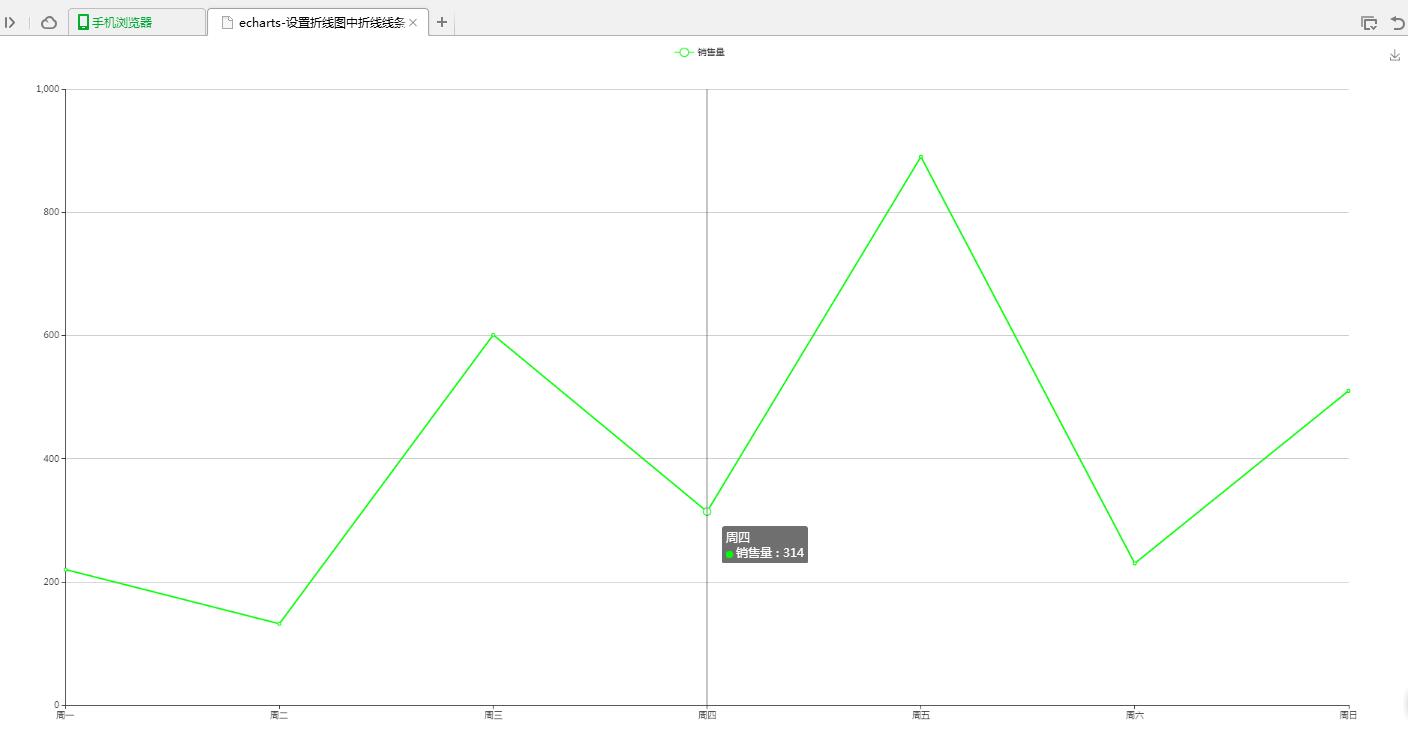
</html>(3)折点自定义颜色
<!DOCTYPE html>
<html>
  <head>
    <meta charset="UTF-8">
    <title>echarts-设置折线图中折线线条颜色和折线点颜色</title>
    <link rel="shortcut icon" href="../js/echarts-2.2.7/doc/asset/ico/favicon.png" rel="external nofollow" rel="external nofollow" rel="external nofollow" >
    <script type="text/javascript" src="../js/echarts-2.2.7/doc/asset/js/jquery.min.js" ></script>
    <script type="text/javascript" src="../js/echarts-2.2.7/doc/example/www2/js/echarts-all.js" ></script>
    <style>
      body,html{
        width: 99%;
        height: 99%;
        font-family: "微软雅黑";
        font-size: 12px;
      }
      #line{
        width: 100%;
        height: 100%;
      }
    </style>
    <script>
      $(function(){
        var chart = document.getElementById('line');
        var echart = echarts.init(chart);
        var option = {
          title: {
            text: ''
          },
          tooltip: {
            trigger: 'axis'
          },
          legend: {
            data:['销售量']
          },
          grid: {
            left: '3%',
            right: '4%',
            bottom: '3%',
            containLabel: true
          },
          toolbox: {
            feature: {
              saveAsImage: {}
            }
          },
          xAxis: {
            type: 'category',
            boundaryGap: false,
            data: ['周一','周二','周三','周四','周五','周六','周日']
          },
          yAxis: {
            type: 'value'
          },
          series: [
            {
              name:'销售量',
              type:'line',
              stack: '销售量',
              itemStyle : {
                normal : {
                  color:'#00FF00',
                  lineStyle:{
                    color:'#00FF00'
                  }
                }
              },
              data:[220, 132, 601, 314, 890, 230, 510]
            }
          ]
        };
        echart.setOption(option);
      });
    </script>
  </head>
  <body>
    <div id="line"></div>
  </body>
</html>
3、实现结果
(1)图形自分配颜色
(2)线条自定义颜色
(3)折点自定义颜色
4、问题说明
(1)设置折线线条颜色
lineStyle:{
 color:'#00FF00'
}
(2)设置折线折点颜色
itemStyle : {
 normal : {
  color:'#00FF00'
 }
}
以上是“jQuery插件echarts如何设置折线图中折线线条颜色和折线点颜色”这篇文章的所有内容,感谢各位的阅读!相信大家都有了一定的了解,希望分享的内容对大家有所帮助,如果还想学习更多知识,欢迎关注亿速云行业资讯频道!
免责声明:本站发布的内容(图片、视频和文字)以原创、转载和分享为主,文章观点不代表本网站立场,如果涉及侵权请联系站长邮箱:is@yisu.com进行举报,并提供相关证据,一经查实,将立刻删除涉嫌侵权内容。


