小编给大家分享一下利用R语言的ggplot2包绘制直方图,相信大部分人都还不怎么了解,因此分享这篇文章给大家参考一下,希望大家阅读完这篇文章后大有收获,下面让我们一起去了解一下吧!
一 绘制基本直方图
准备数据及R包
library(ggplot2)set.seed(1234)df <- data.frame(sex = factor(rep(c("F", "M"),each=200)),weight=round(c(rnorm(200, mean=55, sd=5), rnorm(200, mean=65, sd=5))) )head(df) sex weight1 F 492 F 563 F 604 F 435 F 576 F 58
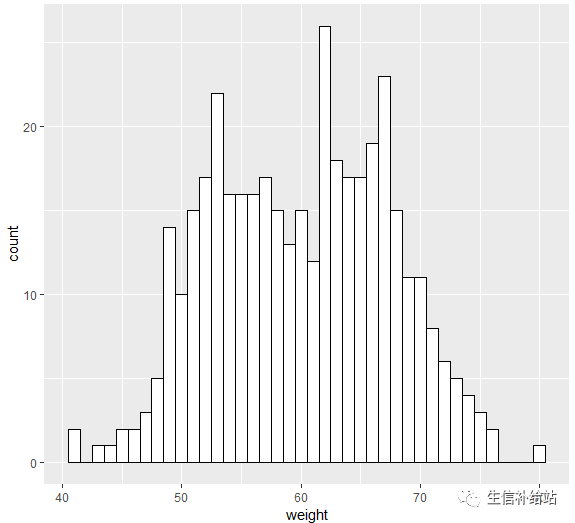
1.1 基本直方图
ggplot(df, aes(x=weight)) +geom_histogram(binwidth=1,color="black",fill="white")# 改变 bins 和 颜色
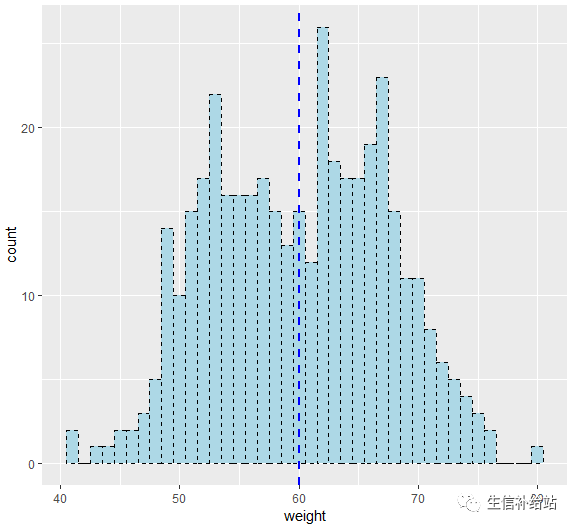
1.2 添加均值线
ggplot(df, aes(x=weight)) +geom_histogram(binwidth=1,color="black", fill="lightblue",linetype="dashed")+ #设置框线类型,颜色和fill的颜色geom_vline(aes(xintercept=mean(weight)), color="blue", linetype="dashed", size=1) #添加均值线,设置线型,颜色等
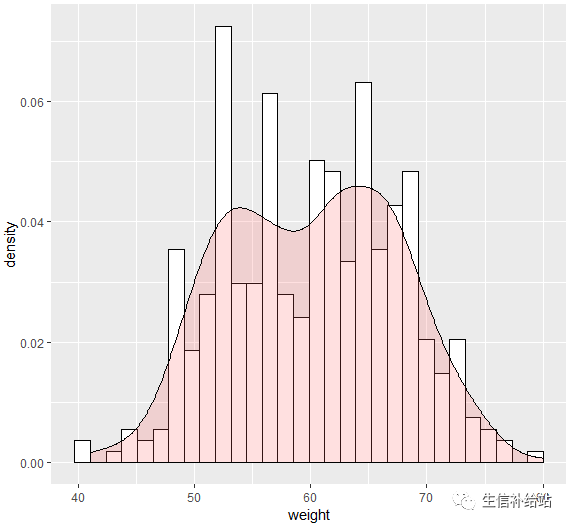
1.3 添加密度曲线
ggplot(df, aes(x=weight)) + geom_histogram(aes(y=..density..), colour="black", fill="white")+ # 需要密度形式 geom_density(alpha=.2, fill="#FF6666")
二 分组设置颜色 线型等
2.1 分组更改线型颜色
ggplot(df, aes(x=weight, color=sex)) +geom_histogram(fill="white", alpha=0.5, position="identity")
其中position可选 “identity”, “stack”, “dodge”. 默认值是 “stack”.

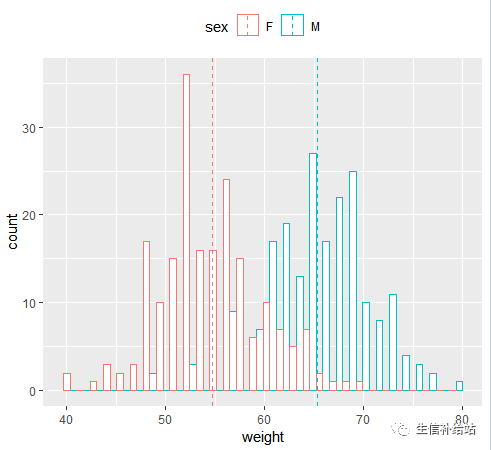
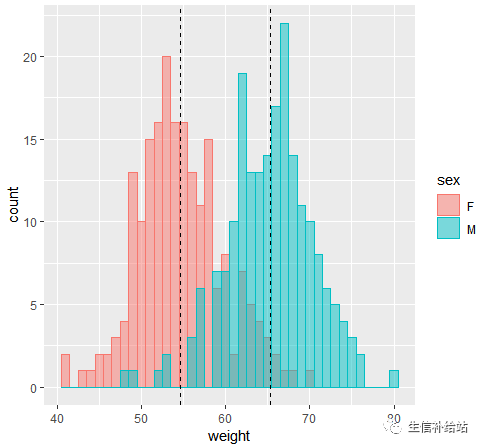
2.2 分组添加均值线
library(plyr)mu <- ddply(df, "sex", summarise, grp.mean=mean(weight))p<-ggplot(df, aes(x=weight, color=sex)) + geom_histogram(fill="white", position="dodge")+ geom_vline(data=mu, aes(xintercept=grp.mean, color=sex), linetype="dashed")+ theme(legend.position="top")p
自定义颜色
# Use custom color palettesp+scale_color_manual(values=c("#999999", "#E69F00", "#56B4E9"))# Use brewer color palettesp+scale_color_brewer(palette="Dark2")# Use grey scalep + scale_color_grey() + theme_classic() + theme(legend.position="top")
分组更改fill的颜色
ggplot(df, aes(x=weight, fill=sex, color=sex)) + geom_histogram(binwidth=1,position="identity", alpha=0.5)+ geom_vline(data=mu, aes(xintercept=grp.mean),linetype="dashed")
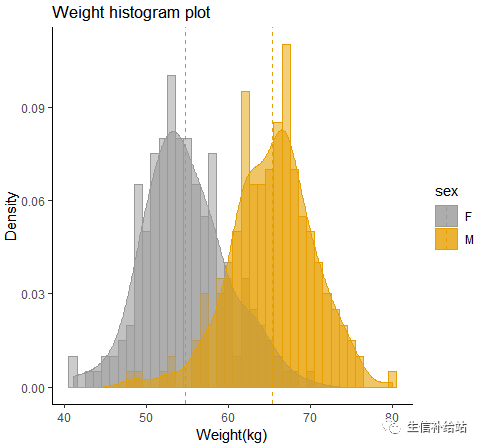
三 汇总展示
ggplot(df, aes(x=weight, color=sex, fill=sex))+geom_histogram(binwidth=1,aes(y=..density..), position="identity", alpha=0.5)+geom_density(alpha=0.6)+geom_vline(data=mu, aes(xintercept=grp.mean, color=sex),linetype="dashed")+scale_color_manual(values=c("#999999", "#E69F00", "#56B4E9"))+scale_fill_manual(values=c("#999999", "#E69F00", "#56B4E9"))+labs(title="Weight histogram plot",x="Weight(kg)", y ="Density")+theme_classic()
以上是“利用R语言的ggplot2包绘制直方图”这篇文章的所有内容,感谢各位的阅读!相信大家都有了一定的了解,希望分享的内容对大家有所帮助,如果还想学习更多知识,欢迎关注亿速云行业资讯频道!
免责声明:本站发布的内容(图片、视频和文字)以原创、转载和分享为主,文章观点不代表本网站立场,如果涉及侵权请联系站长邮箱:is@yisu.com进行举报,并提供相关证据,一经查实,将立刻删除涉嫌侵权内容。


